Zebra3D Statistical Model
Zebra3D implements statistical analysis in attempt to prioritize functionally significant 3D-variability observed among homologs and filter out functionally insignificant 3D-structural divergence which is due to random fluctuations in protein structures. The currently implemented general-purpose statistical model attempts to discriminate SSRs, which feature 3D-specificity among protein families, from conformational variants, which are the result of average structural plasticity/flexibility not associated with function. For a particular purpose, user can implement a proprietary statistical model, e.g. to estimate significance of identified SSRs with respect to superfamily-specific or function-specific conformational plasticity. The guidelines for implementation of a user-created statistical model are provided on this page.
The finally selected SSRs are automatically prioritized according to their statistical significance Z-scores. This final statistical analysis step does not affect the number, length or content of SSRs, but only determines their ranking (i.e. the order of appearance in output files) and significance scores. The primary focus of Zebra3D is on 3D-specificity observed among members of different families/subfamilies and characterized by a significantly different organization of local 3D-structure (e.g. different length and organization/orientation of superimposed structural regions) in homologs. Thus, the currently implemented general-purpose statistical model attempts to discriminate SSRs, which feature 3D-specificity among protein families, from conformational variants, which are the result of average structural plasticity/flexibility not associated with function. A detailed explanation and justification for the default statistical model is provided in the Zebra3D publication. This tutorial is focused solely on substituting the default model with user-curated one, for a particular purpose due to specific research objective.
[return to toc]
The format of current statistical model
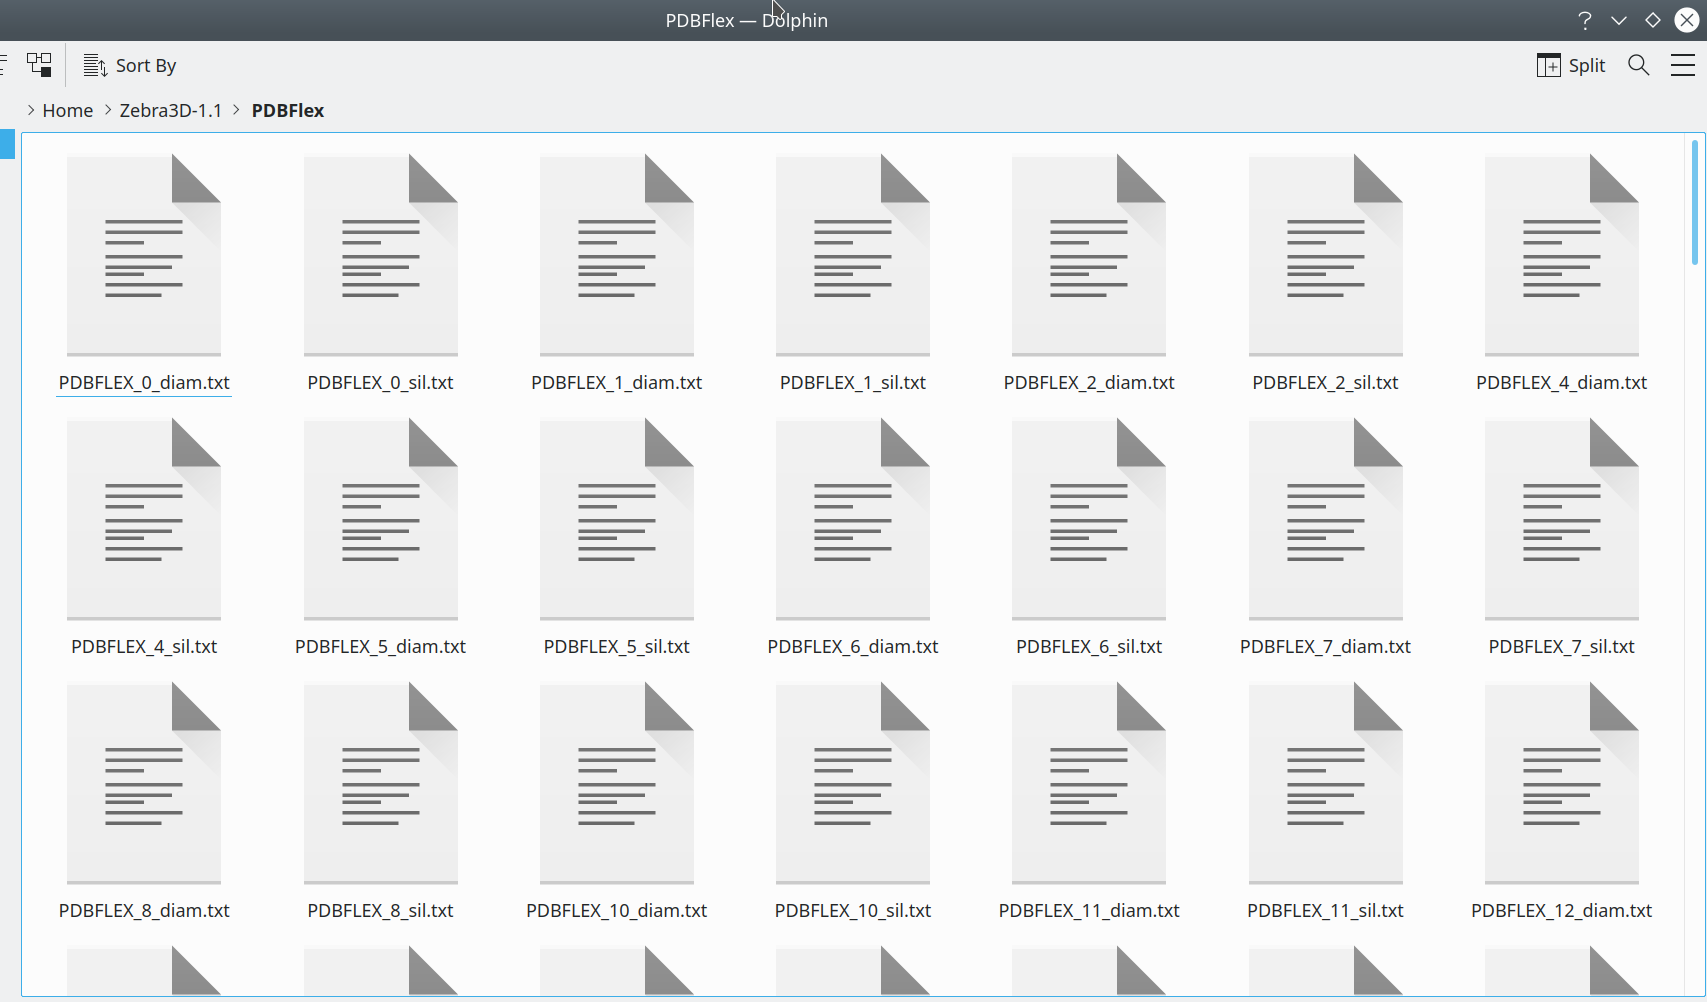
The default statistical model is placed in the ./PDBFlex folder within Zebra3D source code. Each PDBFlex set #X is represented by two plain text files PDBFLEX_[X]_diam.txt and PDBFLEX_[X]_sil.txt as shown on the figure below. By default, X must within a range [0; 100), but not necessarily consecutive (e.g. files with IDs 0, 1, 2, 15, 99 are OK, but file with ID 100 or 115 will not be considered, by default).
[Click here to enlarge]
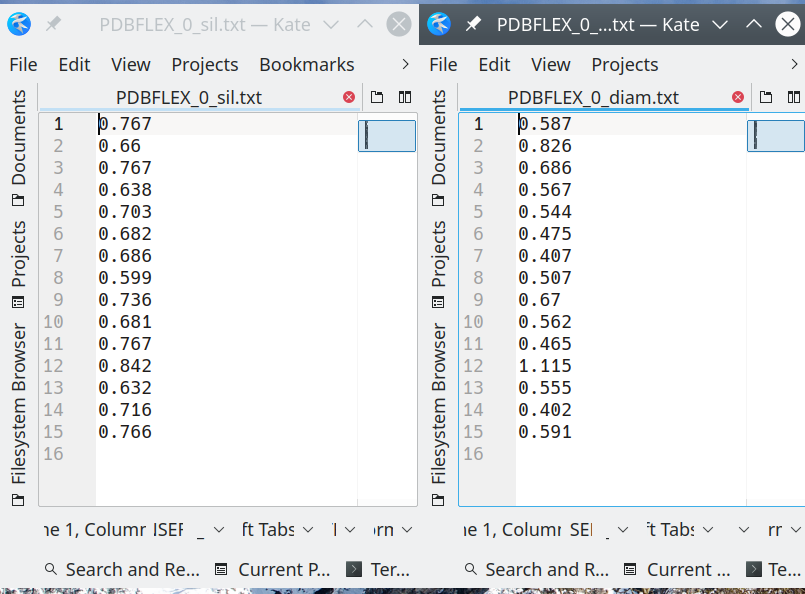
Each two files PDBFLEX_[X]_diam.txt and PDBFLEX_[X]_sil.txt contain the diameter and silhouette values, respectively, one value per line, for each SSR detected in that set. The two values for the same SSR are located on same line in the two files. Diameter and silhouette for SSR #k are placed on the line k within each file.
[Click here to enlarge]
[return to toc]
The source code method to read in the statistical model
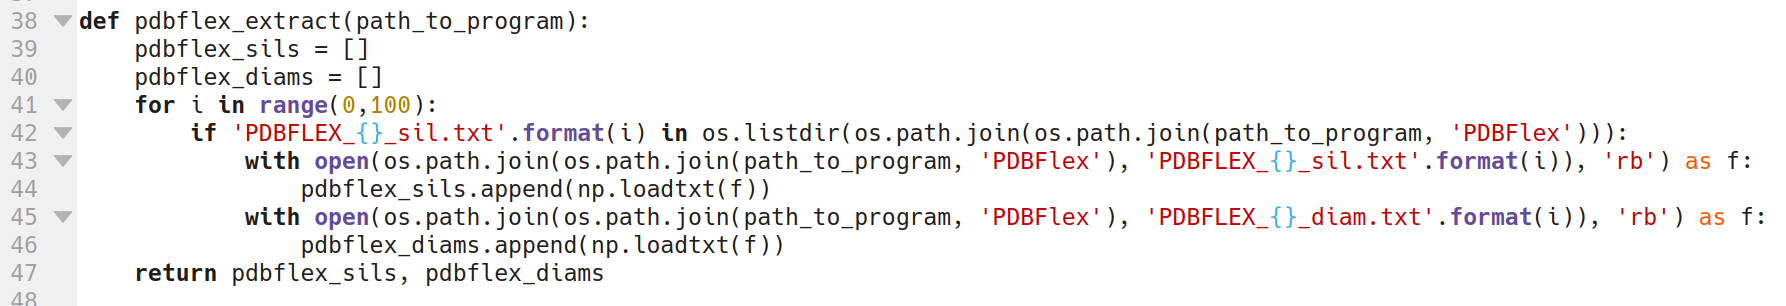
To implement a proprietary statistical mode the user can either format the respective data in the same format as described above, at most 200 files representing 100 sets, i.e. X must within a range [0; 100). Alternatively, the user can alter or rewrite the method in the Zebra3D source code that reads-in the default statistical model according to his/her preference. The method is entitled pdbflex_extract and it placed at the very top of the main Zebra3D.py file:
[Click here to enlarge]