Zebra3D Algorithm Outline
Zebra3D identifies subfamily-specific regions (SSRs) in a 3D-alignment of multiple proteins - i.e. patterns of local 3D-structure (e.g., single residues, loops, or secondary structure fragments) that are spatially equivalent within at least two families/subfamilies (i.e. clusters), but are different between them - and thus represent plausible determinants of functional diversity in a superfamily. The finally selected SSRs are automatically prioritized - i.e. the most visually prominent SSRs that are spatially consistent within clusters/subfamilies, but distant from each other, are ranked first and accompanied by estimates of statistical significance Z-scores to facilitate their expert analysis.
A detailed description of all steps of the algorithm is provided in the Zebra3D publication.
In brief, the input to the Zebra3D is a 3D-alignment of protein structures in the PDB format accompanied by its sequence representation in the FASTA format. The Zebra3D analysis is carried out exclusively on the 3D-level of the protein backbone, i.e. only the heavy backbone atoms (C, Cα, N, and O) are considered in each position and the amino acid types and side-chain atoms are disregarded. The correspondence between positions (i.e., the alignment itself) is taken from the sequence representation (i.e., the FASTA input file) as this information cannot be unambiguously recovered from the 3D-coordinate superimposition alone.
The algorithm has three main steps:
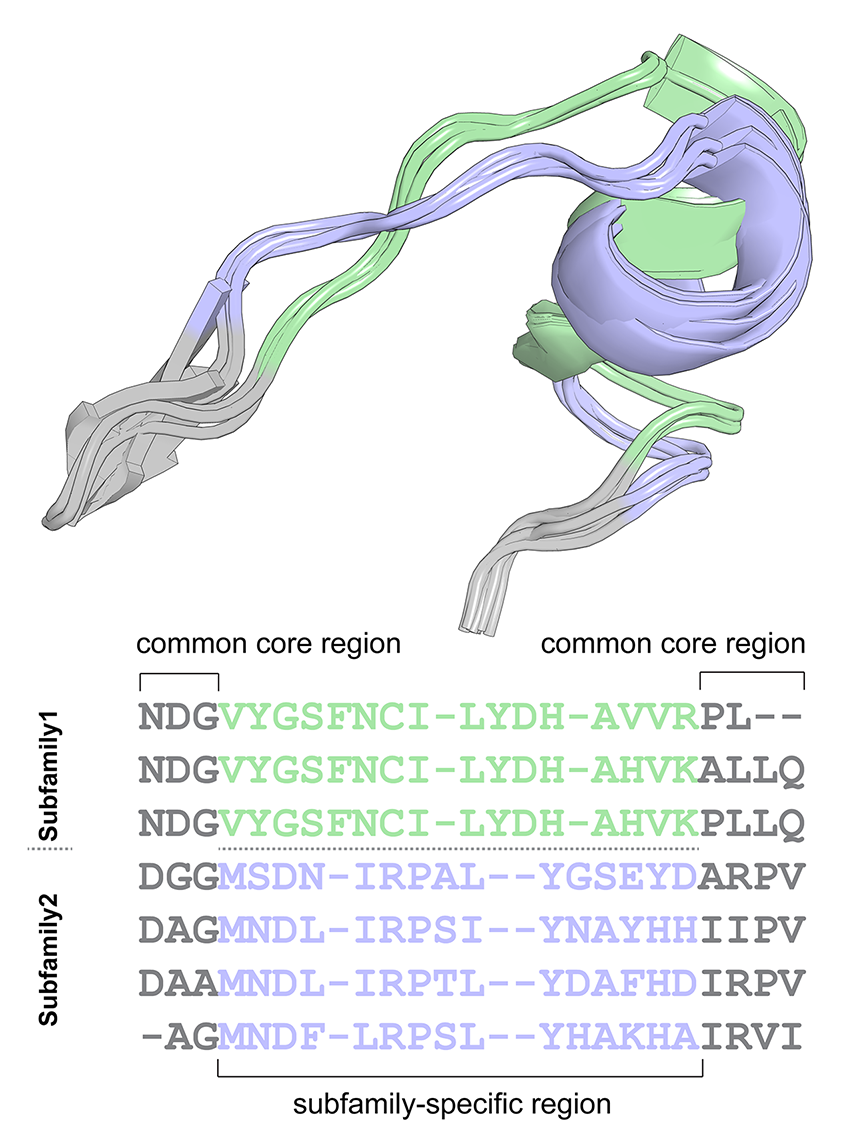
- The “common core” regions are selected as “columns” of the 3D-alignment that contain low content of gaps in the sequence version of the alignment and low content of spatially misaligned residues in the 3D-superimposition;
- The “variable” regions that reside in-between the selected “common core” positions are subjected to a machine-learning cluster analysis technique (HDBSCAN, OPTICS or DBSCAN) in attempt to reveal whether they implement a 3D-specificity pattern, i.e. feature fragments of local structure that are spatially equivalent within subfamilies/clusters, but different between subfamilies/clusters;
- The finally selected SSRs are ranked in descending order of the estimated specificity S-scores and statistical significance Z-scores, i.e. the most visually prominent and statistically significant hits are shown first.