Zebra3D Results
Zebra3D provides two types of useful results: a list of SSRs themselves and, for each such region, classification of proteins into subfamilies. Each region is evaluated independently; thus, the subfamily assignment may vary between finally selected SSRs. SSRs are automatically prioritized according to their 3D-specificity S-scores and statistical significance Z-scores. The most visually prominent SSRs that are spatially consistent within clusters/subfamilies, but distant from each other, are ranked first to facilitate their expert analysis. The accompanying Z-scores indicate whether the observed 3D-specificity is significantly different from random fluctuations in a protein structure.
- Zebra3D progress log output
- Overview of the results
- Output files with a summary of the results
- Output files with details on each SSR
[return to toc]
Zebra3D progress log output
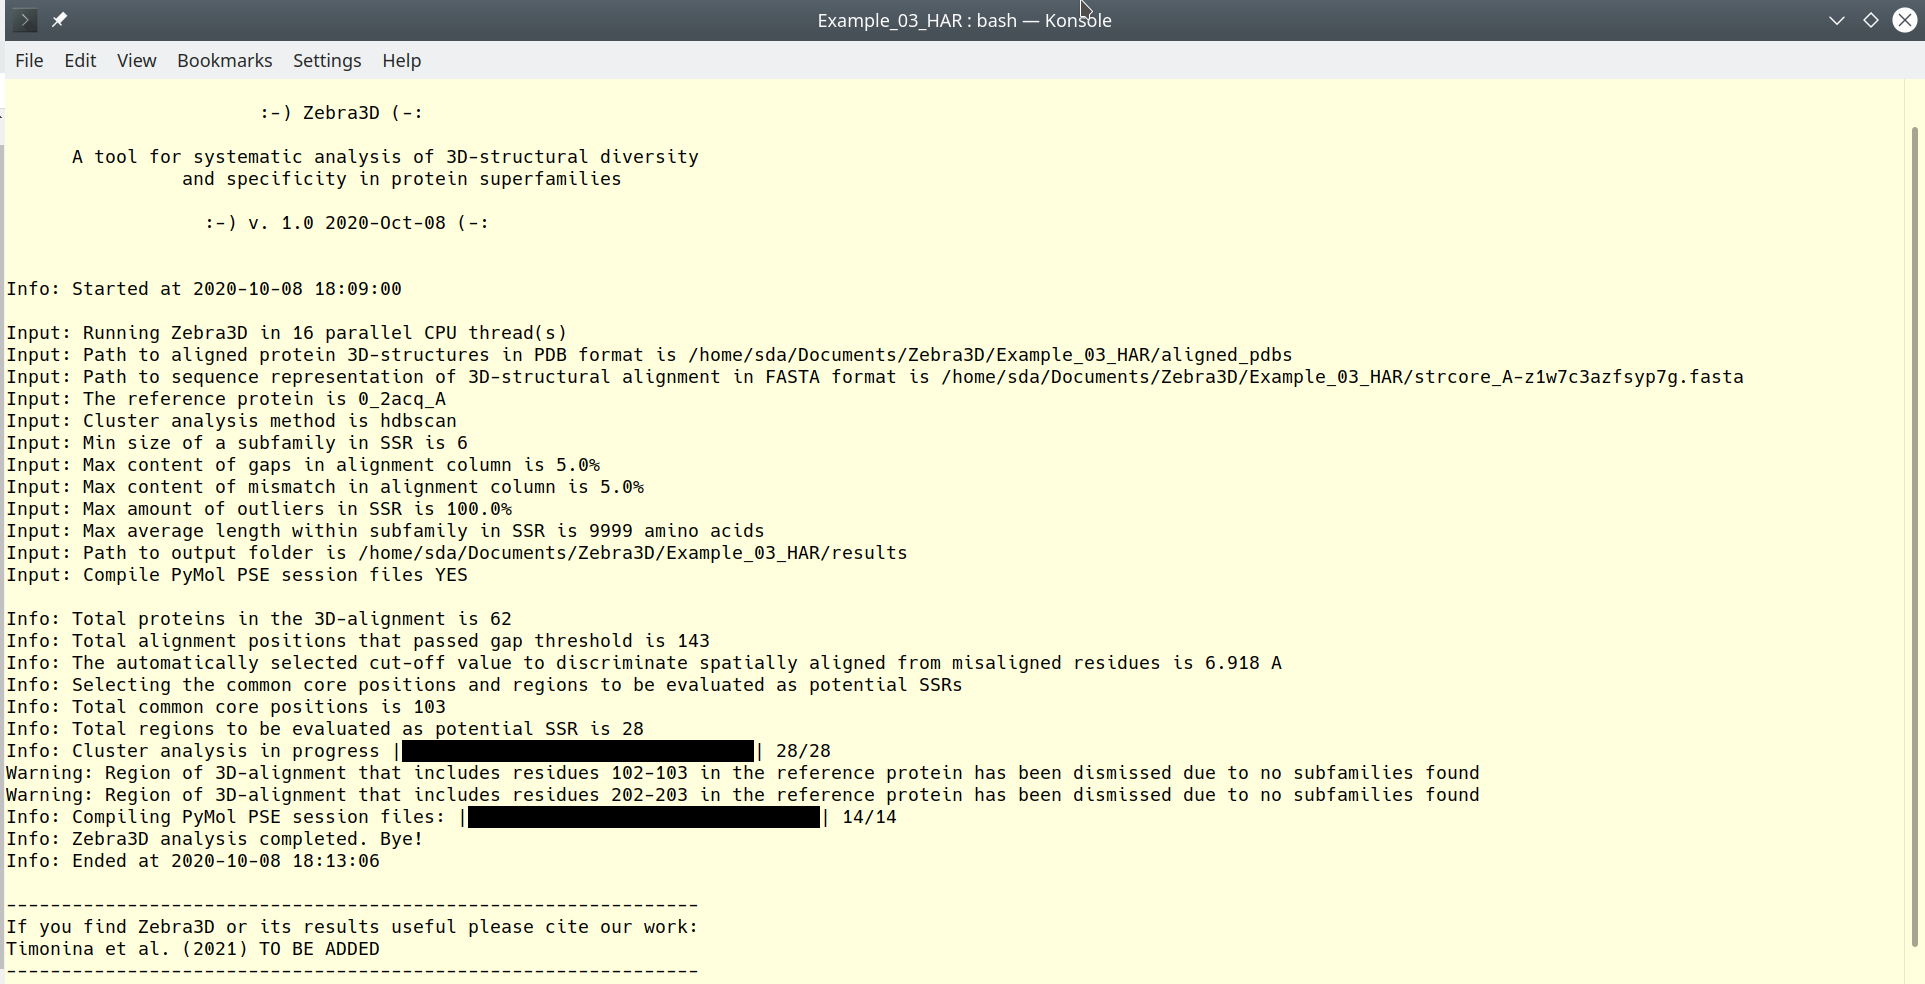
The Zebra3D software logs all its activities to the standard output stream. Users are advised to always check this log for warnings and errors. In particular, if input validation or the task fail, this on-line log will contain a detailed description of the problem. Example of the standard output is provided below:
[Click here to enlarge]
[return to toc]
Overview of the results
If successful, plain text files and binary 3D-annonations with intuitive visual representation of the results will be created:
- Files entitled
RESULTS.xxxcontain a summary of the results, as explained below; - Files entitled
ssr_rank.xxxcontain a detailed description of each SSR, as explained further below.
Example output is illustrated below:

[Click here to enlarge]
[return to toc]
Output files with a summary of the results
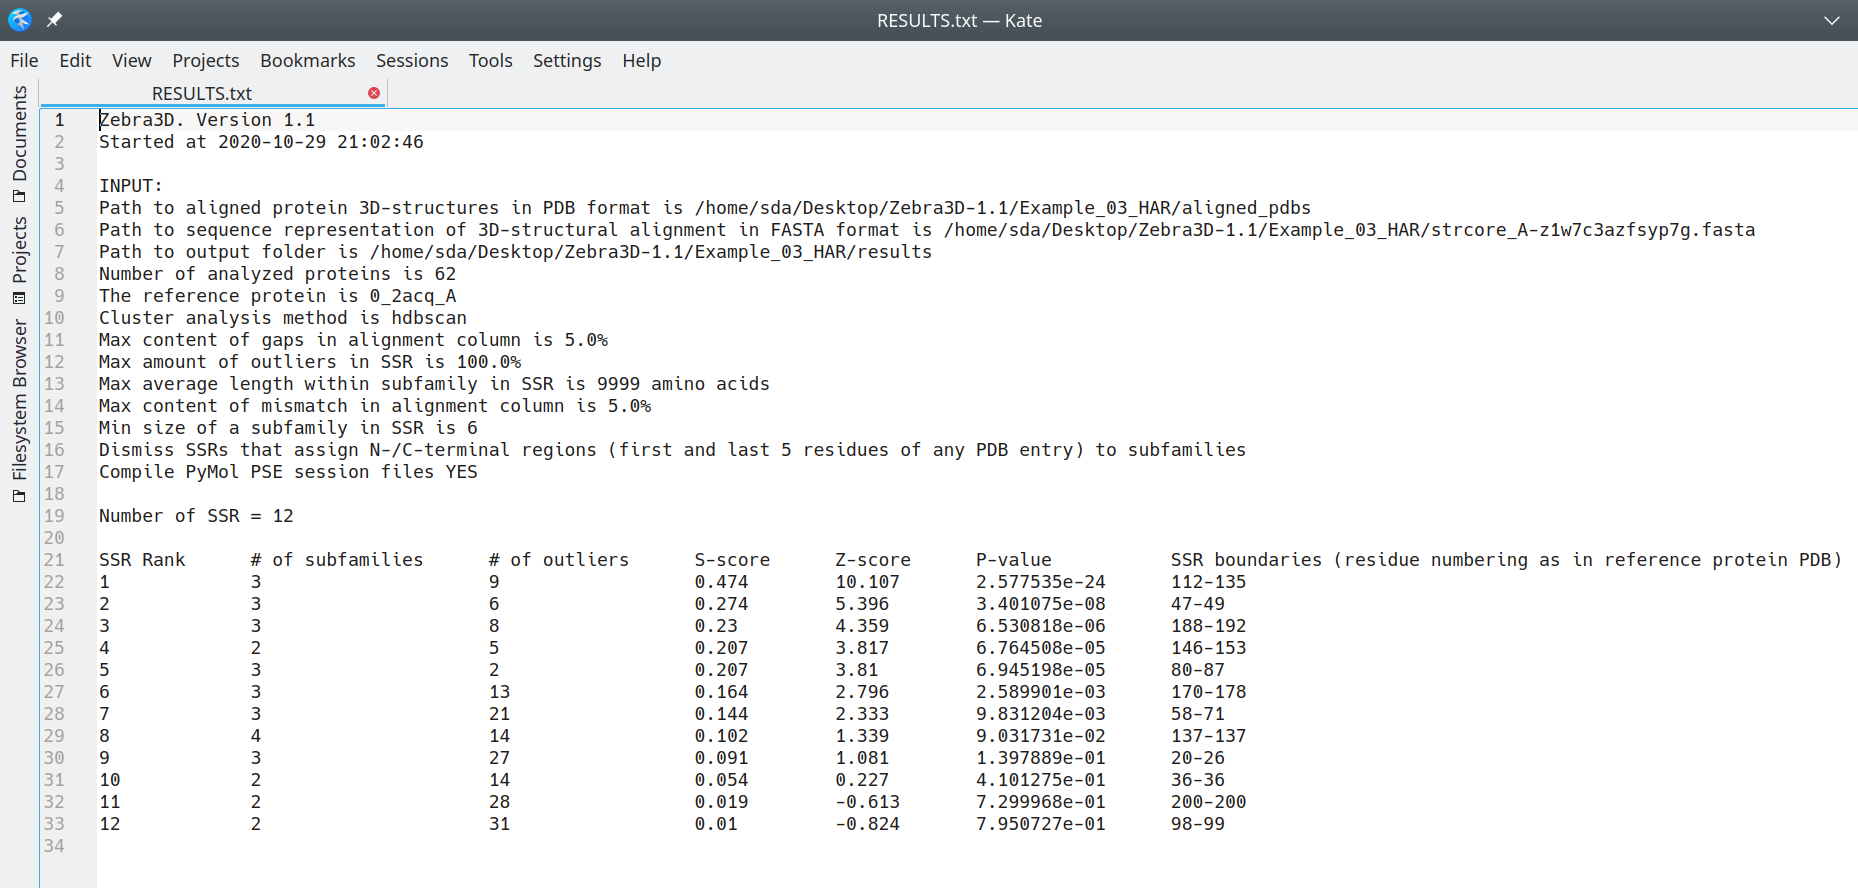
The RESULTS.txt summary file contains the following data:
- Version of the Zebra3D program that was used to create the results;
- Date and time of the task execution;
- Summary of all input parameters;
- The total number of proteins in the 3D-alignment;
- The total number of identified SSRs;
- For each SSR, the following details are provided:
- SSR's rank;
- number of identified subfamilies (3D-clusters);
- number of outliers (fragments of local structure featuring a unique spatial orientation);
- specificity S-score (see Zebra3D publication for details);
- statistical significance Z-score and the corresponding P-value (see Zebra3D publication for details);
- residue numbering (i.e. boundaries of the SSR) as in the structure of the reference protein;
The ranking of SSRs in this summary file is further implemented in all other output files. Example of RESULTS.txt is illustrated below:
[Click here to enlarge]
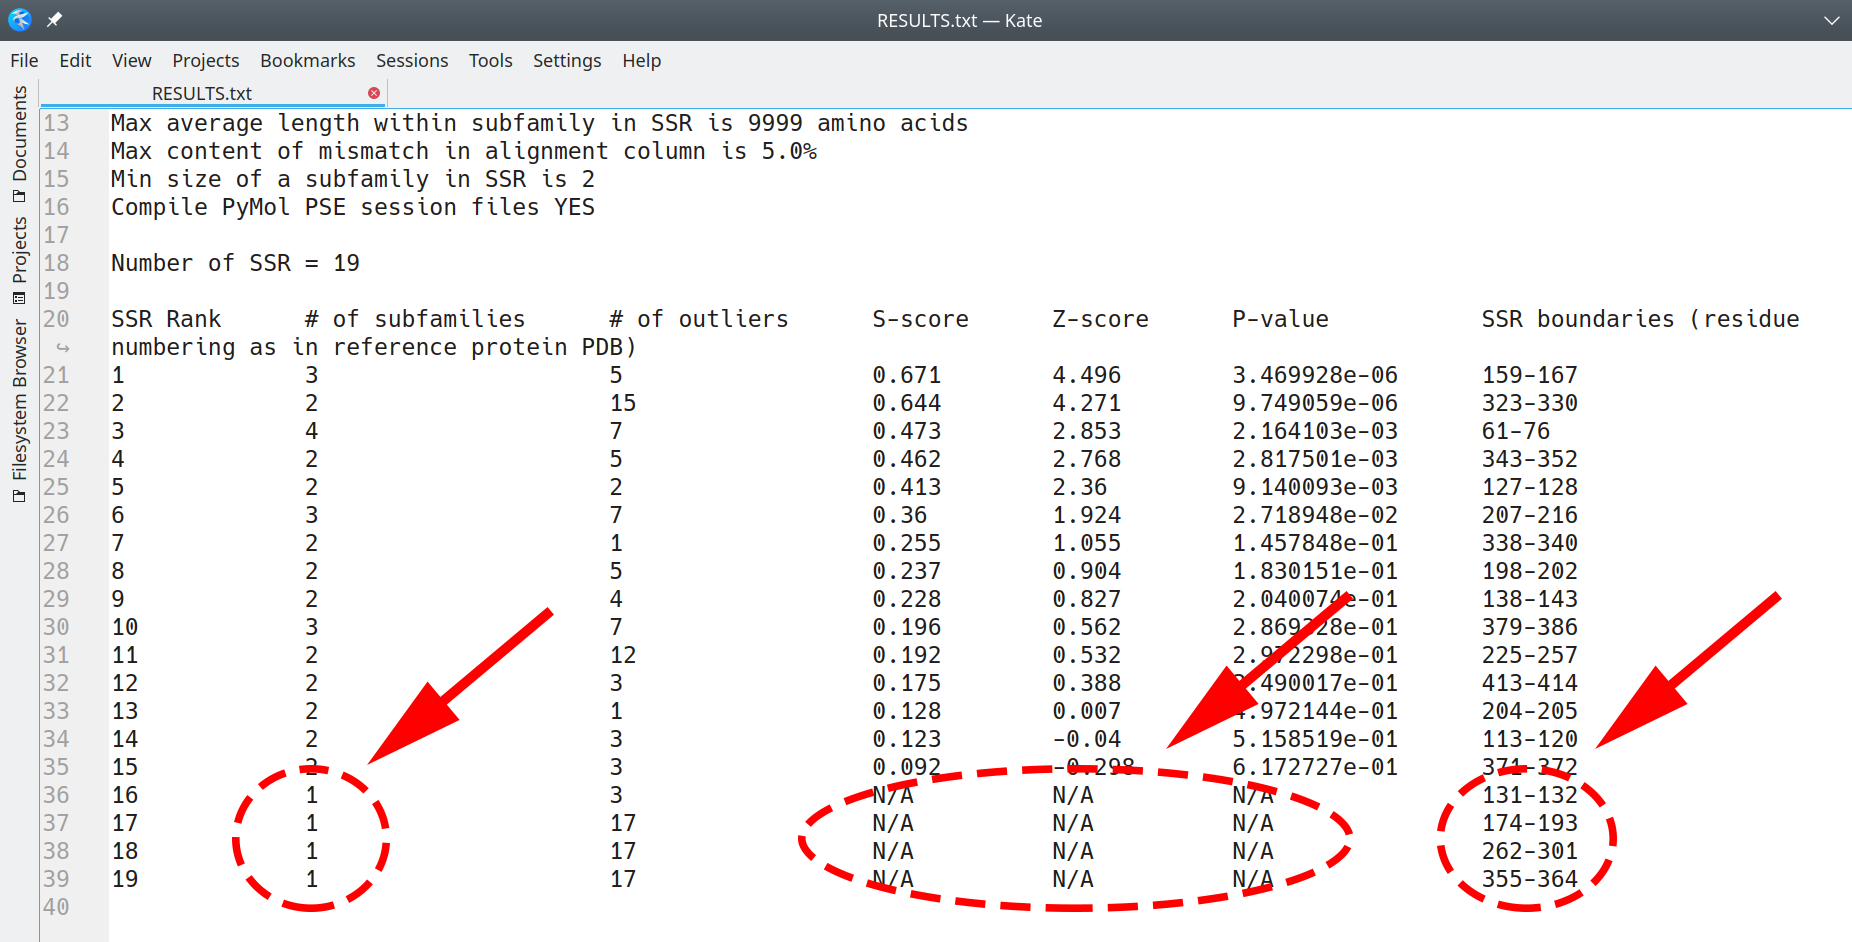
Generally speaking, regions in which machine-learning identified at least two subfamilies represent the primary output of the Zebra3D. As a supplement, regions that revealed only one compact cluster/subfamily accompanied by unique configurations (outliers) are also listed in the output, for consideration by the expert. If identified in the alignment, such special regions would be assigned zero or 'N/A' scores and ranked last, separately from “canonical” SSRs (i.e. featuring 2+ subfamilies/clusters). An example of such RESULTS.txt is illustrated below (i.e. single-cluster+outliers SSRs are placed in the end of the list with zero-N/A scores, separately from the "canonical" SSRs):
[Click here to enlarge]
The accompanying RESULTS.pse file is a binary 3D-annotation file in the 'PSE' format for PyMol featuring all identified SSRs mapped onto the structure of the representative protein. The SSRs are named/numbered according to their rank (i.e. as in the RESULTS.txt file), and gradient-painted from red-to-grey proportional to the statistical significance Z-scores, i.e. intensive red corresponds to the top-ranking most significant SSRs. The RESULTS.py is an instruction file that was submitted to PyMol to create the RESULTS.pse binary 3D-annotation. It can be edited and executed manually, for a particular purpose: pymol -qc RESULTS_edited.py. An example of a Zebra3D's RESULTS.pse 3D-annotation of the results is illustrated below:

[Click here to enlarge]
[return to toc]
Output files with details on each SSR
Each SSR is further described in details in a series of dedicated files. The files are named/numbered according to their rank (i.e. as in the RESULTS.txt file). The content of these files is as follows:
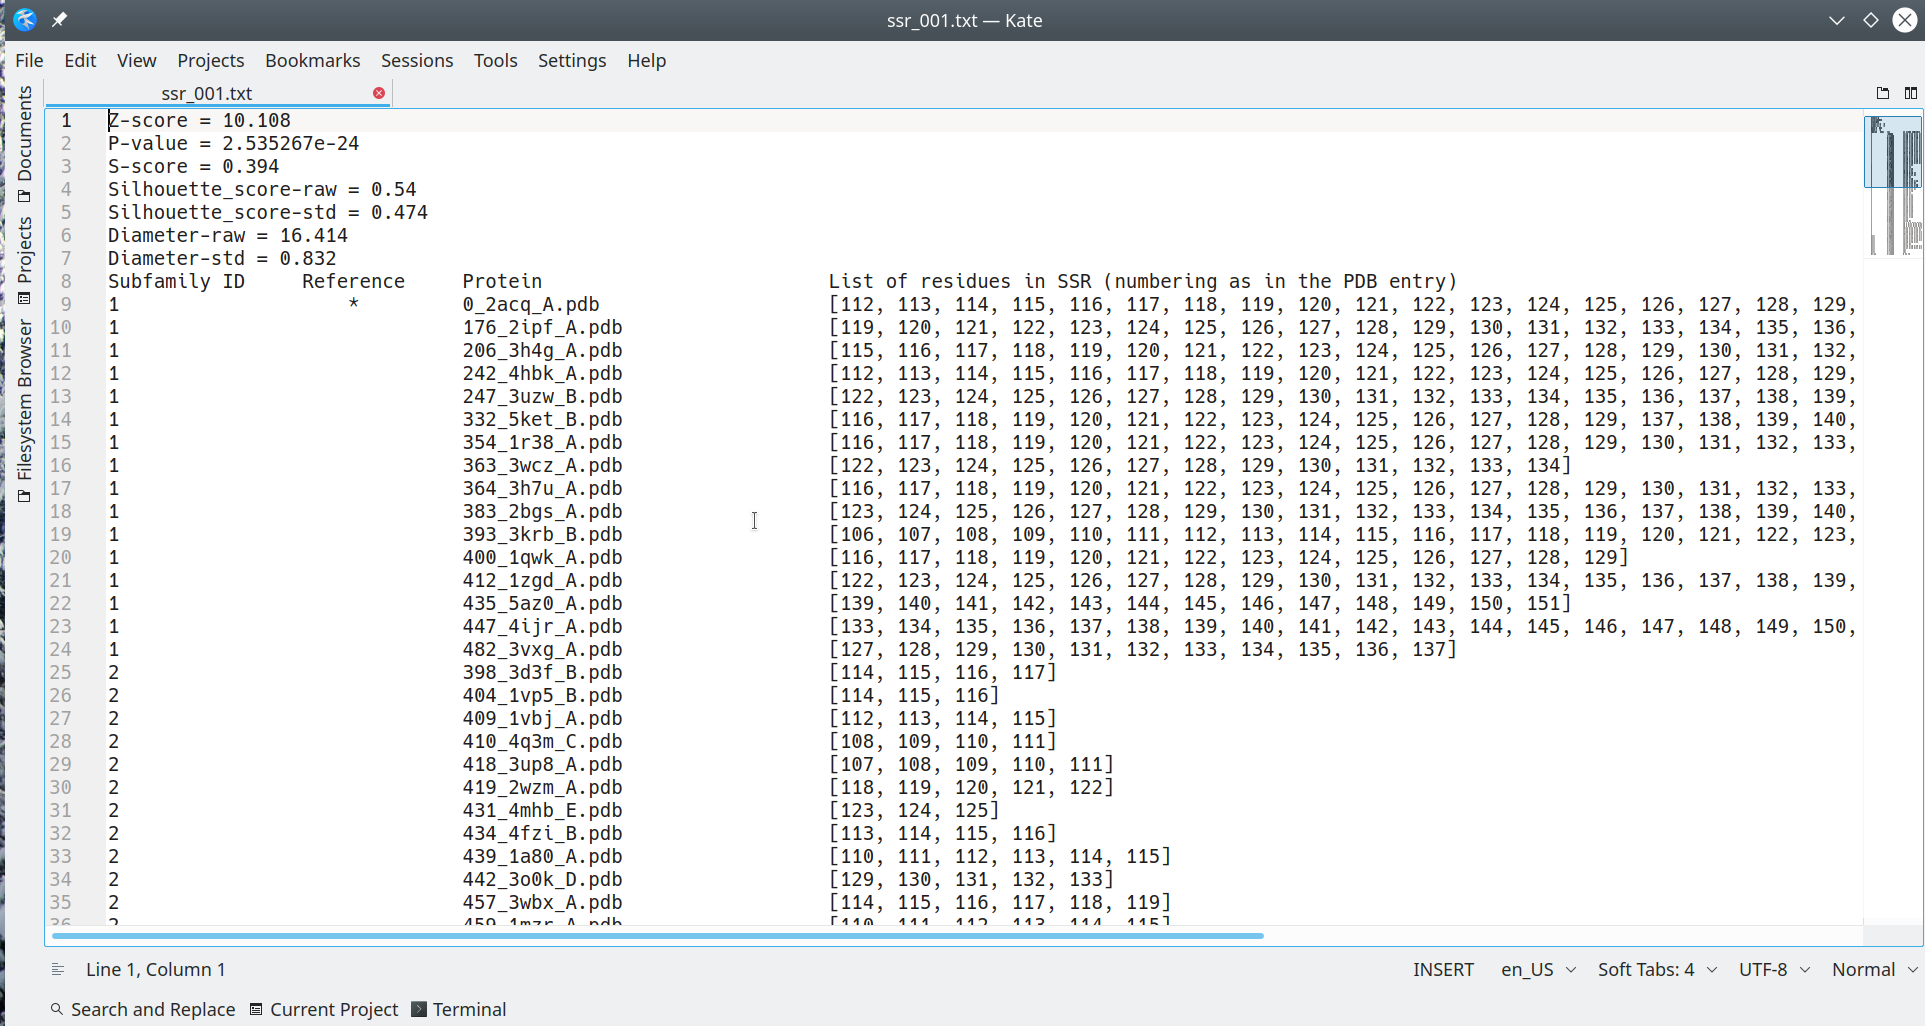
The ssr_rank.txt file is plain text file containing the following data:
- Statistical significance Z-score, corresponding P-value, and the specificity S-score;
- The raw and standardized Silhouette and Diameter metrics which were used to calculate the S-score and Z-score, see Zebra3D publication for details;
- The subfamily classification - i.e. the assignment of each protein from the input alignment to one of the subfamilies/clusters, or to outliers;
- The location (residue numbering) of the SSR in the structure of each protein from the input alignment, numbered as in the respective PDB entry;
An example is illustrated below:
[Click here to enlarge]
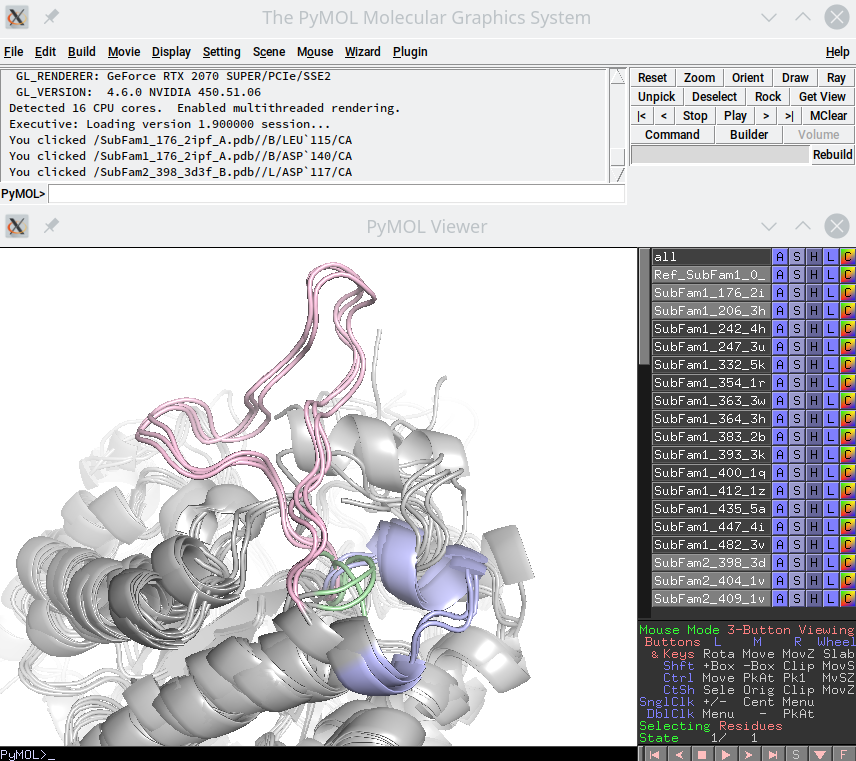
The ssr_rank.pse file is a binary file in the 'PSE' format for PyMol with a 3D-annotation of the SSR, presented in a way which is convenient for visual expert analysis, as follows:
- Full-size structures of all proteins from the input alignment are included into the annotation, and colored in grey;
- The respective fragments of protein structures that belong to the current SSR and were classified into subfamilies are color-coded according to their subfamilies using tint shades in PyMol (palegreen, lightblue, lightpink, wheat etc.);
- The respective fragments of protein structures that belong to the current SSR and were assigned into outliers are colored in intensive blue;
- Proteins are listed in the PyMol object panel (i.e. to the right of the 3D-viewer) and named/numbered according to the subfamily assignment, which is indicated by the prefix:
Subfam1_,Subfam2_,Subfam3_, etc.Outlier_; - The reference protein has an extra prefix
Ref_in the PyMol object panel; - In the PyMol object panel you can turn on and off each protein 3D-structure, to improve visual appearance or to focus expert inspection only on the particular proteins.
An example of such 3D-annotation is provided below. The viewport shows 3D-annotation of one subfamily-specific region, a few structures from each of the three subfamilies are enabled in the viewer, the respective fragments of protein structures are colored in palegreen, lightblue, lightpink, no outliers are shown:
[Click here to enlarge]
The ssr_rank.py is an instruction file that was submitted to PyMol to create the ssr_rank.pse binary 3D-annotation. It can be edited and executed manually, for a particular purpose: pymol -qc ssr_rank_edited.py Finally, the ssr_rank.fasta is a plain text file with a sequence alignment of protein fragments within the SSR, to be used for a particular purpose.