Zebra output
The first output of Zebra is a list of automatically proposed classifications of proteins into specificity groups. The second output is a list of conserved and specific positions for each proposed classification. The results are automatically prioritized according to the statistical significance. The on-line interactive analysis toolkit is the hallmark of Zebra2. The results are primarily web-based and provided at four information levels to facilitate the knowledge-driven expert selection of the most promising positions on-line: as a sequence similarity network, interfaces to sequence-based and 3D-structure-based analysis of conservation and variability, and accompanied by the detailed annotation of proteins accumulated from the integrated databases with links to the external resources (i.e., PDB, Uniprot, BacDive, BRENDA). The results can also be downloaded to a local computer.
- Residue numbering in the Zebra output
- General description
- On-line interactive analysis toolkit: the hallmark of Zebra2
- The download page
[return to toc]
Residue numbering in the Zebra output
Please note, that the residue numbering in the Zebra output may differ from the numbering in the PDB file that you have originally submitted. E.g., amino acid residues with identical IDs within the same chain will be identified and renumbered automatically. The complete list of changes to your query PDB will be printed to the log file. The most important changes will be colored in red. Press the "Log" button to view the on-line log page. E.g.:
Warning: Amino acid residues with identical residue IDs have been identifies and will be renumbered as described below

Warning: Residues A-TYR-169 and A-PRO-169 have the same residue ID

Warning: Offseting all residue IDs starting from 169 in chain A by 1

Warning: Residues A-HIS-413 and A-GLN-413 have the same residue ID

Warning: Offseting all residue IDs starting from 413 in chain A by 2

Warning: Residues A-PRO-414 and A-HIS-414 have the same residue ID

Warning: Offseting all residue IDs starting from 414 in chain A by 3

Info: Correcting the PDB file...
The corrected PDB file of your query can be downloaded at the "Results" page, see section "The Input data after preprocessing".
[return to toc]
General description
Understanding the role of particular amino acid residues in the molecular mechanism of a protein's function is one of the most challenging problems in modern biology. During evolution of proteins from a common ancestor, one functional property may be preserved, while others may vary as a result of mutations introduced into the protein structure, leading to functional diversity. Highly conserved positions seem to appear during the evolution as a result of the selective pressure and therefore are very useful to indicate properties common for the entire superfamily. The specific positions – also known as “subfamily-specific” or “family-specific” positions (SSP, FSP), “specificity-determining residues/sites/positions” or SDR/SDS/SDP, “evolutionary traces” (ET), etc. – that are conserved only within families/subfamilies, but are different between them, seem to play an important role in functional diversity observed among homologs. Information about both conserved and specific positions can help to understand how the enzyme performs its natural function, while the latter can also be selected as hotspots for directed evolution or rational design experiments in an attempt to improve the wild-type protein variant for a particular purpose. The roles of the identified residues in the protein of interest can be further studied by expert analysis, molecular modelling, and by implementing experimental site‐directed mutagenesis. See Examples for more details. The purpose of Zebra is to provide an intuitive and easy-to-use interface to the analysis of conservation and variability in sequences and structures of homologs implementing diverse properties within a common structural fold of a superfamily. The results are web-based and can be studied on-line. The on-line interactivity is implemented in HTML5 meaning that neither plugins nor Java are required. The results can also be downloaded to a local desktop station for off-line processing and analysis. For this you may need the PyMol molecular graphics engine.
[return to toc]
On-line interactive analysis toolkit: the hallmark of Zebra2
The hallmark of Zebra2 is implementation of on-line tools to present the results at four information levels in a way that should be the most convenient to the human expert: as sequence similarity network, interfaces to sequence-based and 3D-structure-based analysis of the selected conserved and specific positions, and accompanied by a detailed annotation of proteins accumulated from the integrated databases with links to the external resources. The details are provided below.
[return to toc]
Level 1: Sequence similarity network
If you are experiencing technical problems when using the SSN viewer, please see this page.
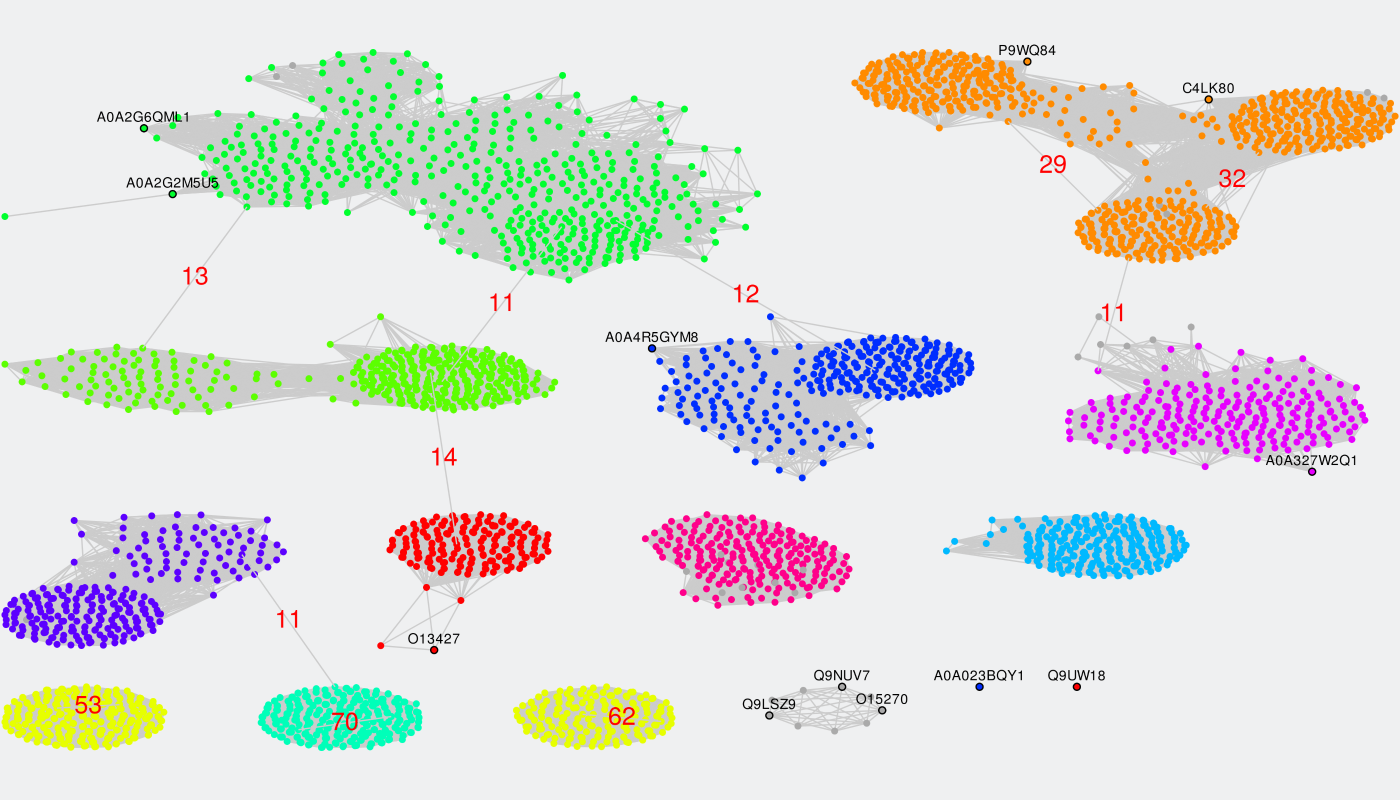
To identify specific positions in a multiple alignment the input proteins have to be classified into functional families/subfamilies (i.e., either automatically or guided by the manual classification submitted by the user). Sequence similarity network represents an effective tool to explore these classifications. This sub-section of the Zebra Analysis page implements the original sequence similarity network (SSN) viewer based on the Cytoscape plugin to visualize functional trends across protein superfamilies from the context of sequence similarity within and between the functional families/subfamilies. If the Zebra algorithm was selected to automatically suggest the functional families/subfamilies in the input set of proteins, then several alternative classifications could have been prepared (i.e., classification #1, #2, etc.) and prioritized by the statistical significance of the corresponding specific positions (the ranking can be learned from the Level 2+3 subsections of the Analysis page). These classification will be provided in the SSN viewer via the color legend applied to nodes representing proteins. The Zebra SSN viewer implements versatile functionality to explore classifications of proteins into specificity groups to complement the sequence statistics of conservation and variability at studying protein superfamilies. The sequence similarity network can also help to select the most informative classifications into specificity groups and to guide the selection of parameters for the clustering algorithms.
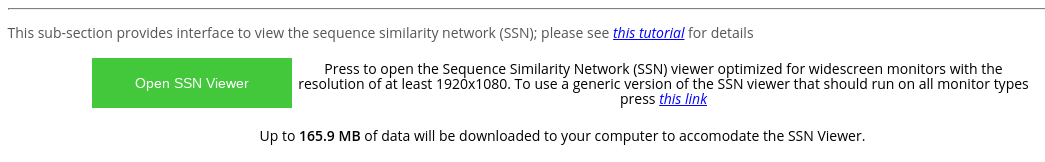
At the "Analysis" page press the "Open SSN Viewer" to open the SSN viewer in a separate tab. Please note the highlighted total size of data files that will be loaded by the on-line tool.
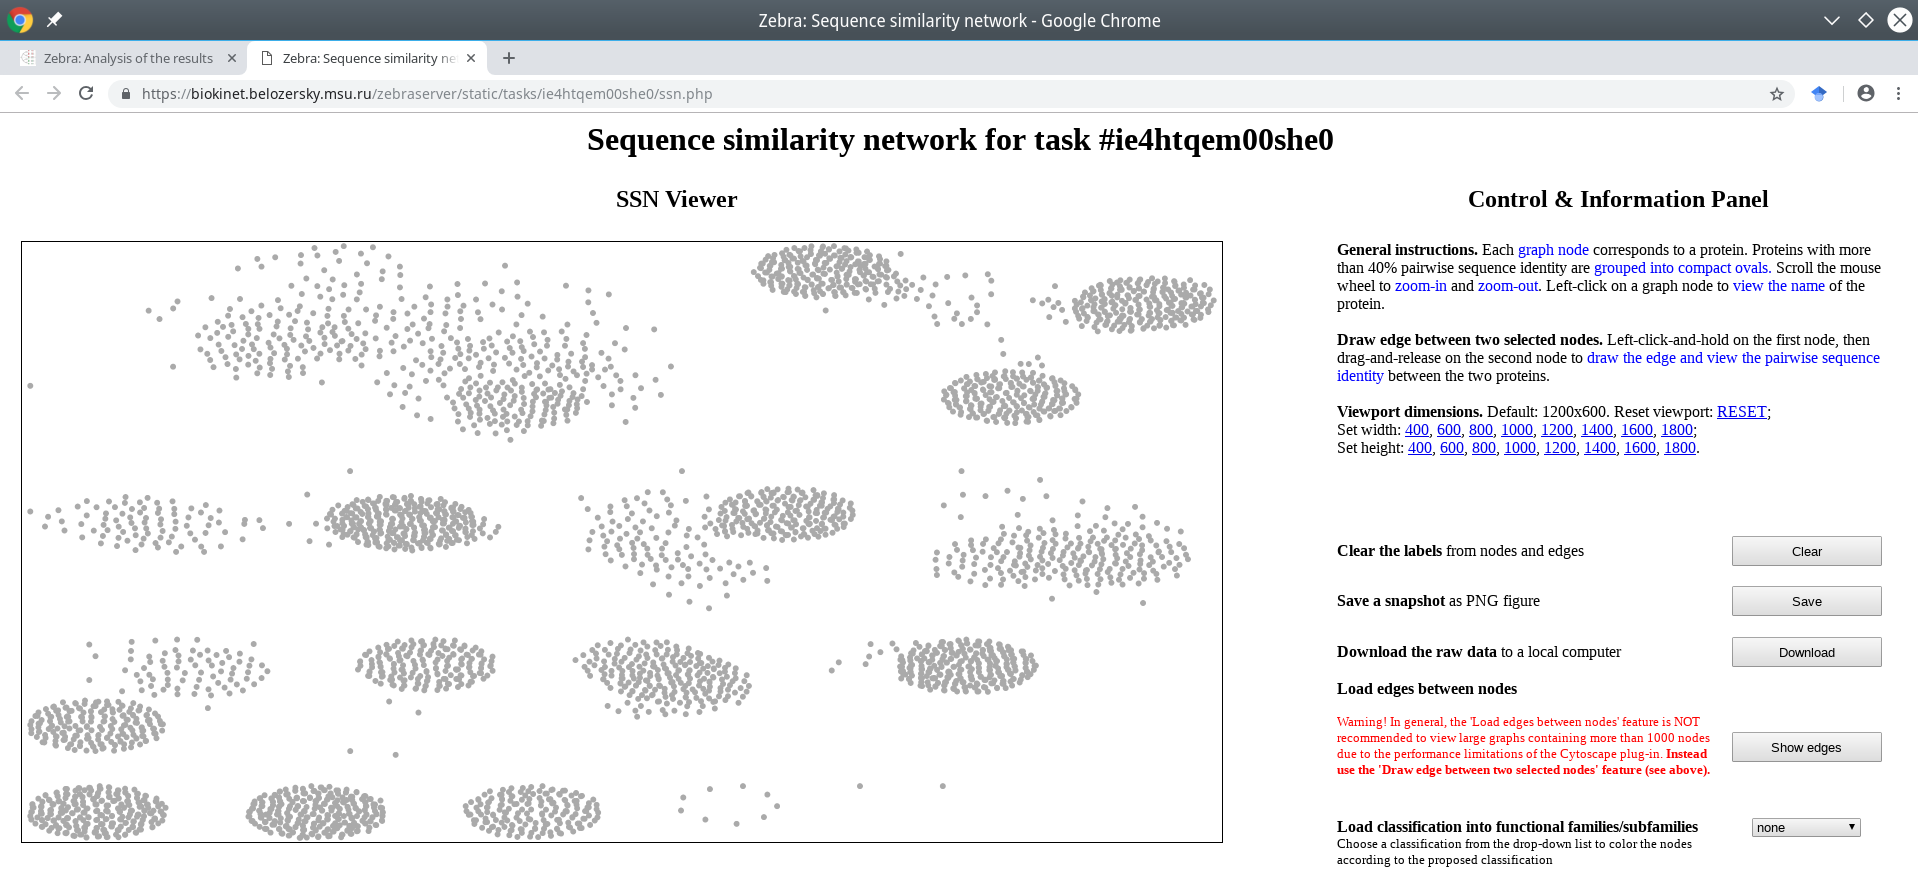
The default layout of the SSN Viewer page was optimized for widescreen monitors with a resolution of 1920x1080, and features the SSN viewport to the left of the screen with general information and action buttons to the right of the screen. Alternatively, you can use the generic version of the SSN viewer that should be compatible with all monitors (press the corresponding blue hyperlink).
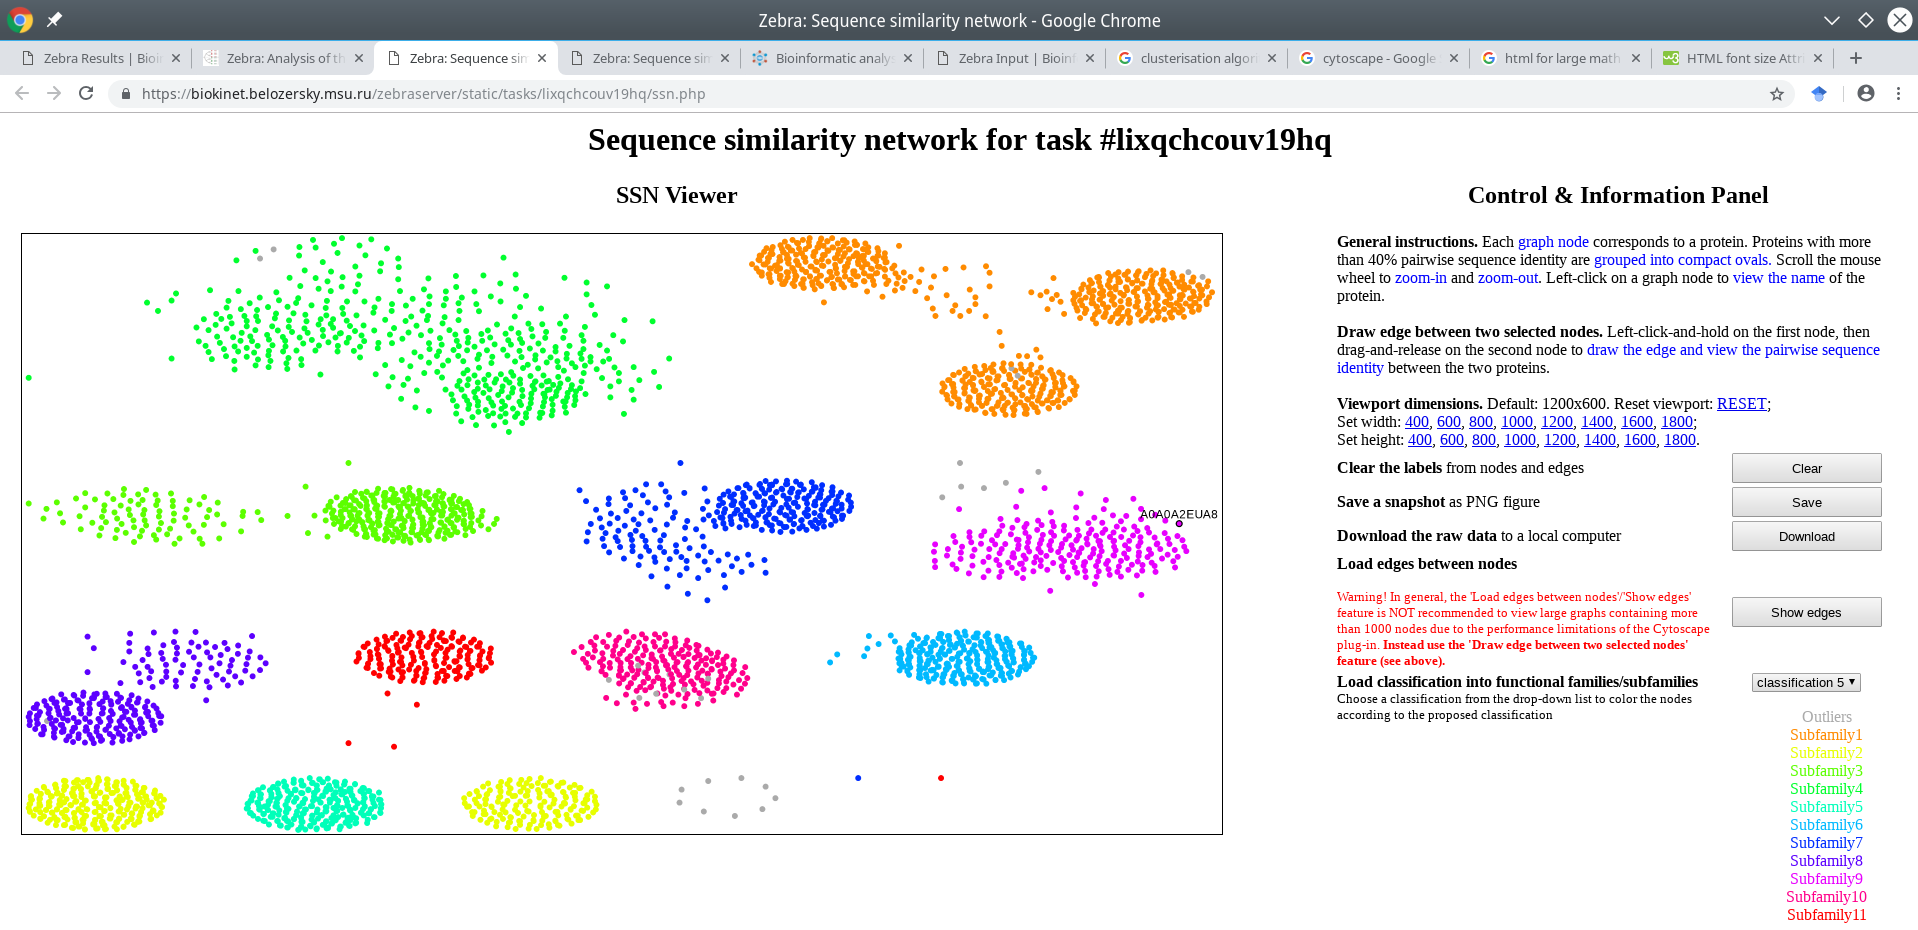
By default, all nodes of the graph are loaded and colored in grey, and all edges are disabled. Each node corresponds to a protein in the multiple sequence alignment. Proteins with at least 40% pairwise sequence identities tend to be grouped into compact ovals.
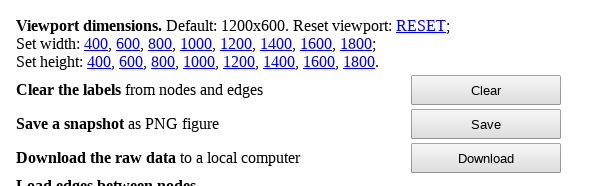
You can change the size of the SSN viewport by clicking on the corresponding links on the right side of the page:
The classification into specificity groups is provided via the color legend that is applied to nodes. If the Zebra algorithm was selected to automatically suggest the functional families/subfamilies in the input set of proteins, then several alternative classifications could have been prepared (i.e., classification #1, #2, etc.) and prioritized by the statistical significance of the corresponding specific positions (the ranking is provided in the Level 2+3 subsections of the Analysis page).
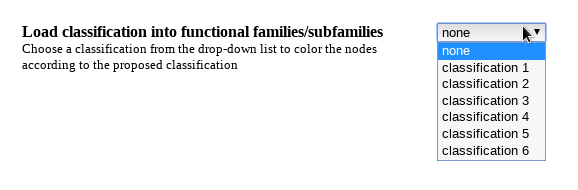
Choose a classification from the drop-down list located on the right side of the screen. The color legend will be applied to the nodes and printed in the lower right corner of the page.
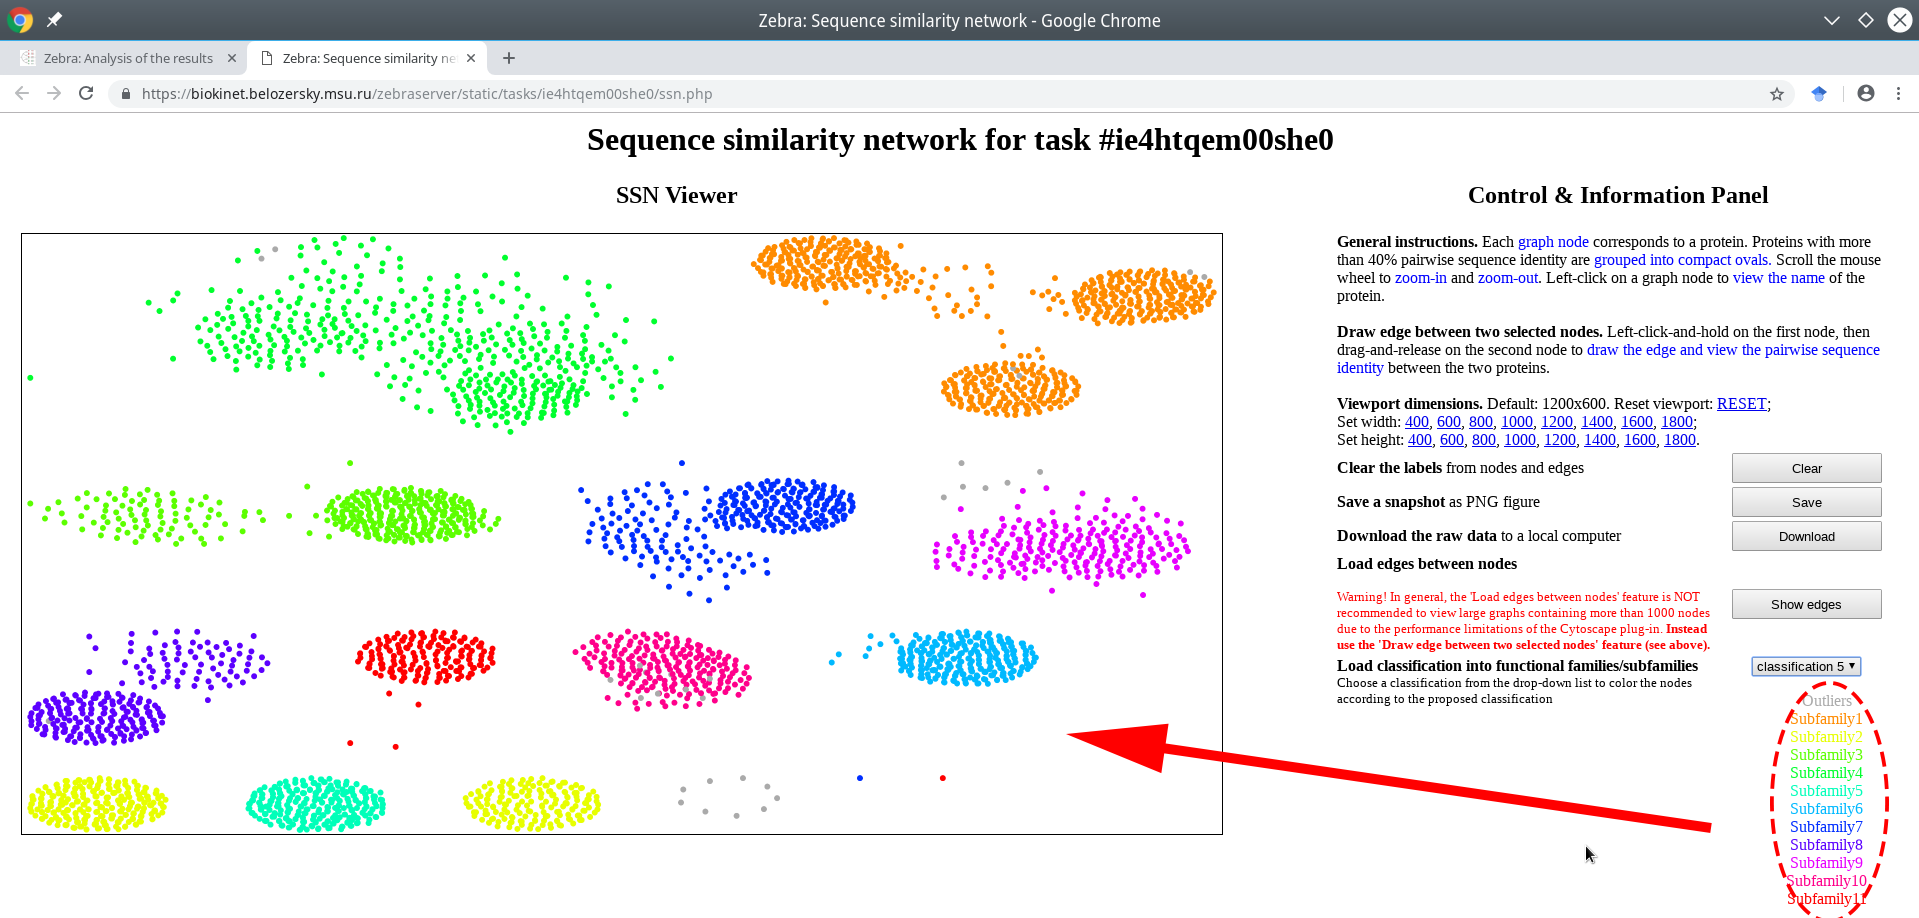
Generally speaking, if you have two physical monitors connected to your Desktop computer, we recommend to open the SSN viewer on one monitor and the interfaces to sequence-based and 3D-structure-based analysis of conservation and variability of the on the second monitor, as these layers of data were designed to complement each other to facilitate expert analysis of the results, e.g.:
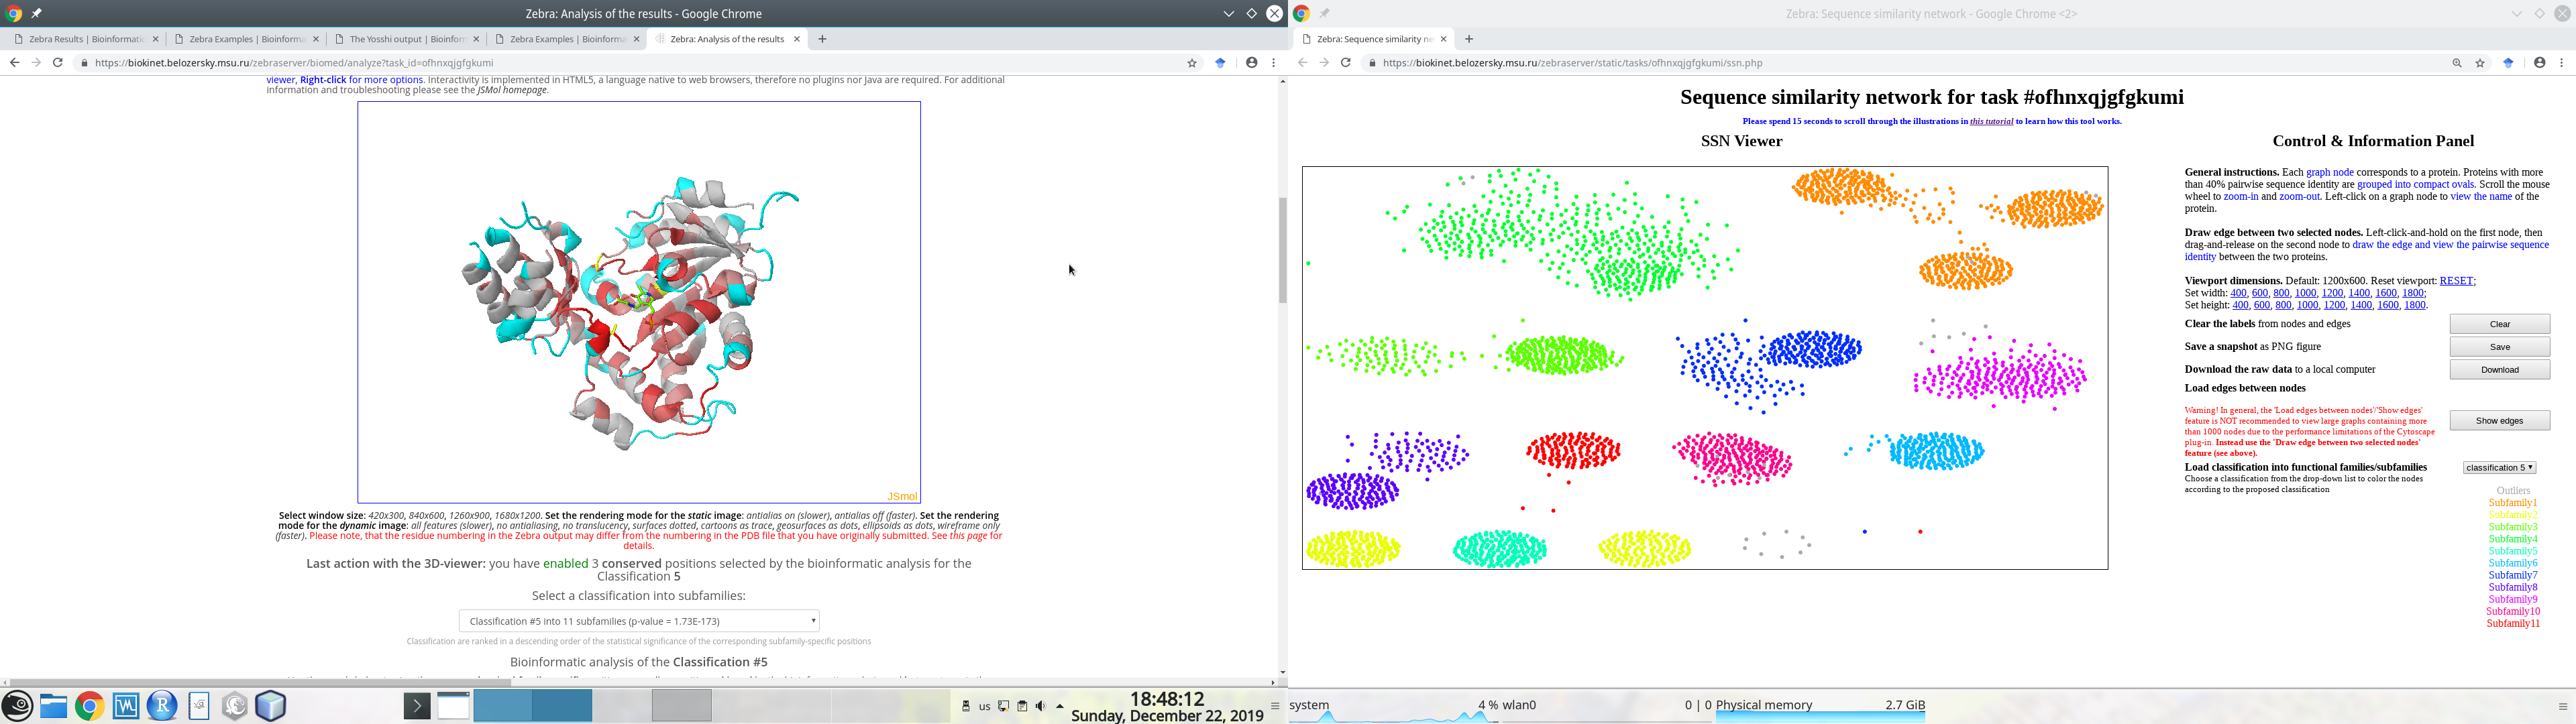
Put the mouse pointer within the SSN viewport. You can now use your mouse wheel to zoom-in and zoom-out. This function is fast even for large graphs of many thousand nodes.
Press the "RESET" link on the right side of the page to reset to the default resolution and re-fit the graph inside the viewport. Alternatively, press the "Re-center" link to re-fit the graph while preserving the currently selected viewport resolution.
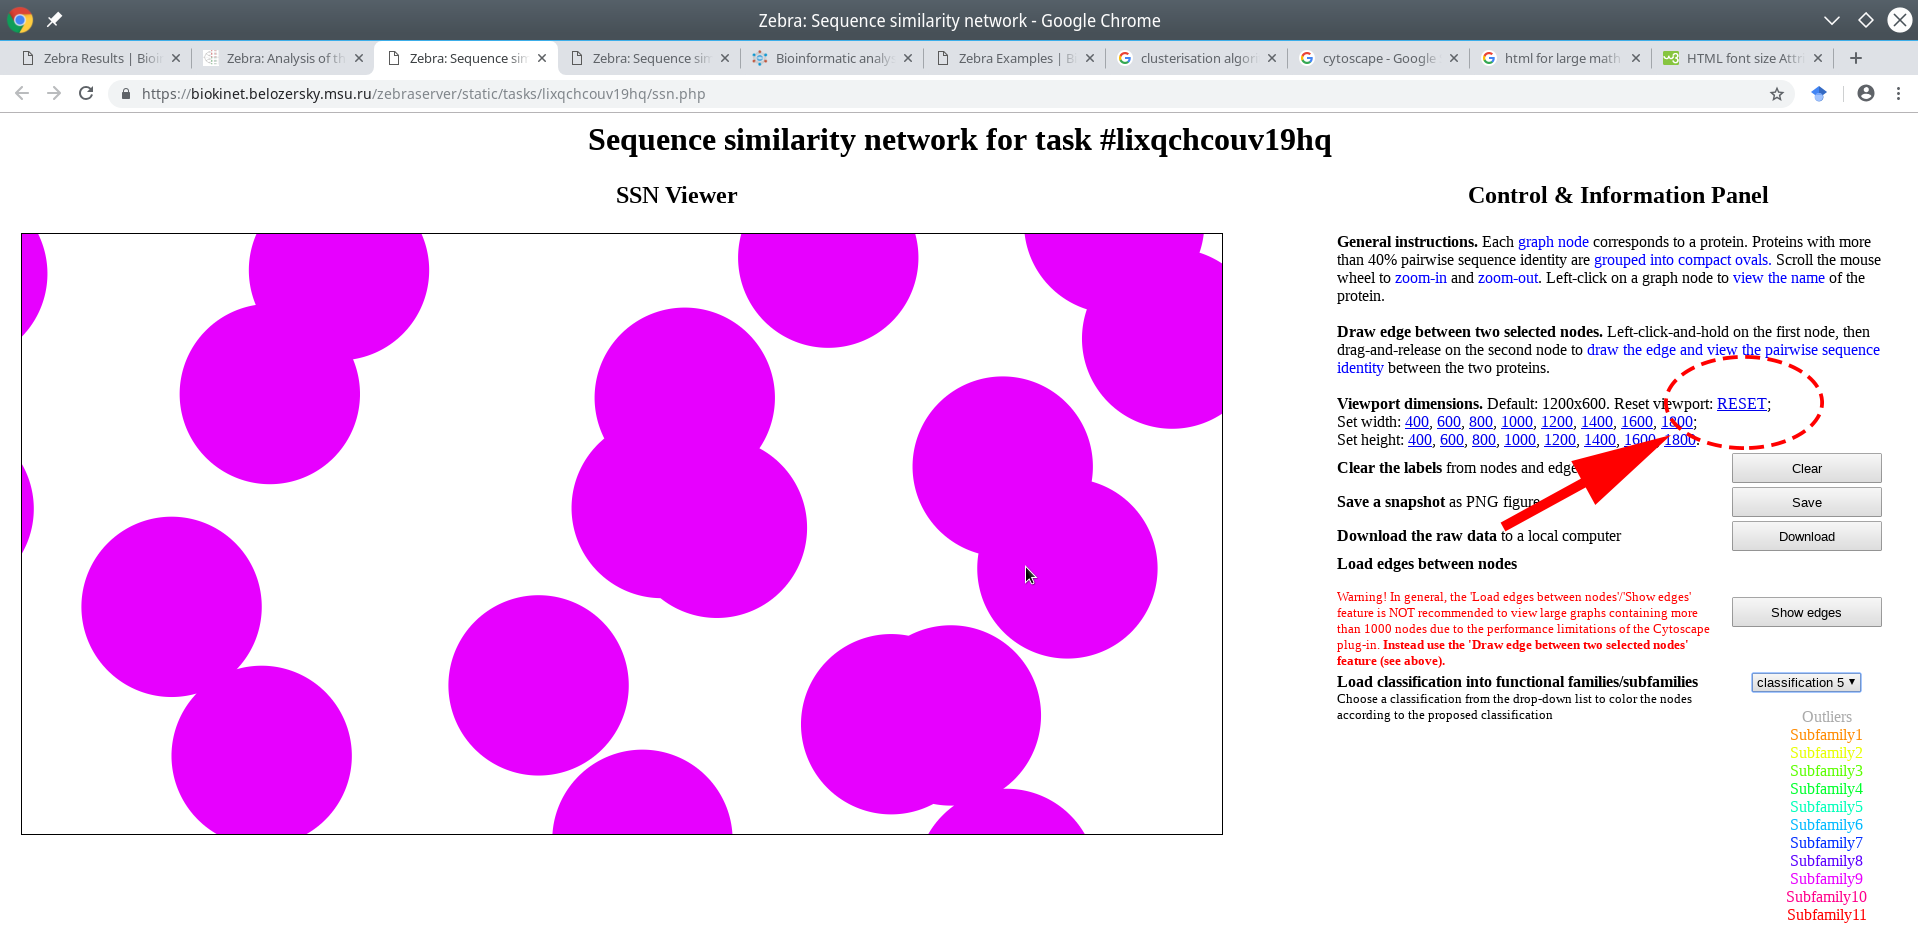
Press the "RESET" link on the right side of the page to reset to the default resolution and re-center the graph inside the viewport
The graph will be re-centered and the viewport will be reset to the default resolution.
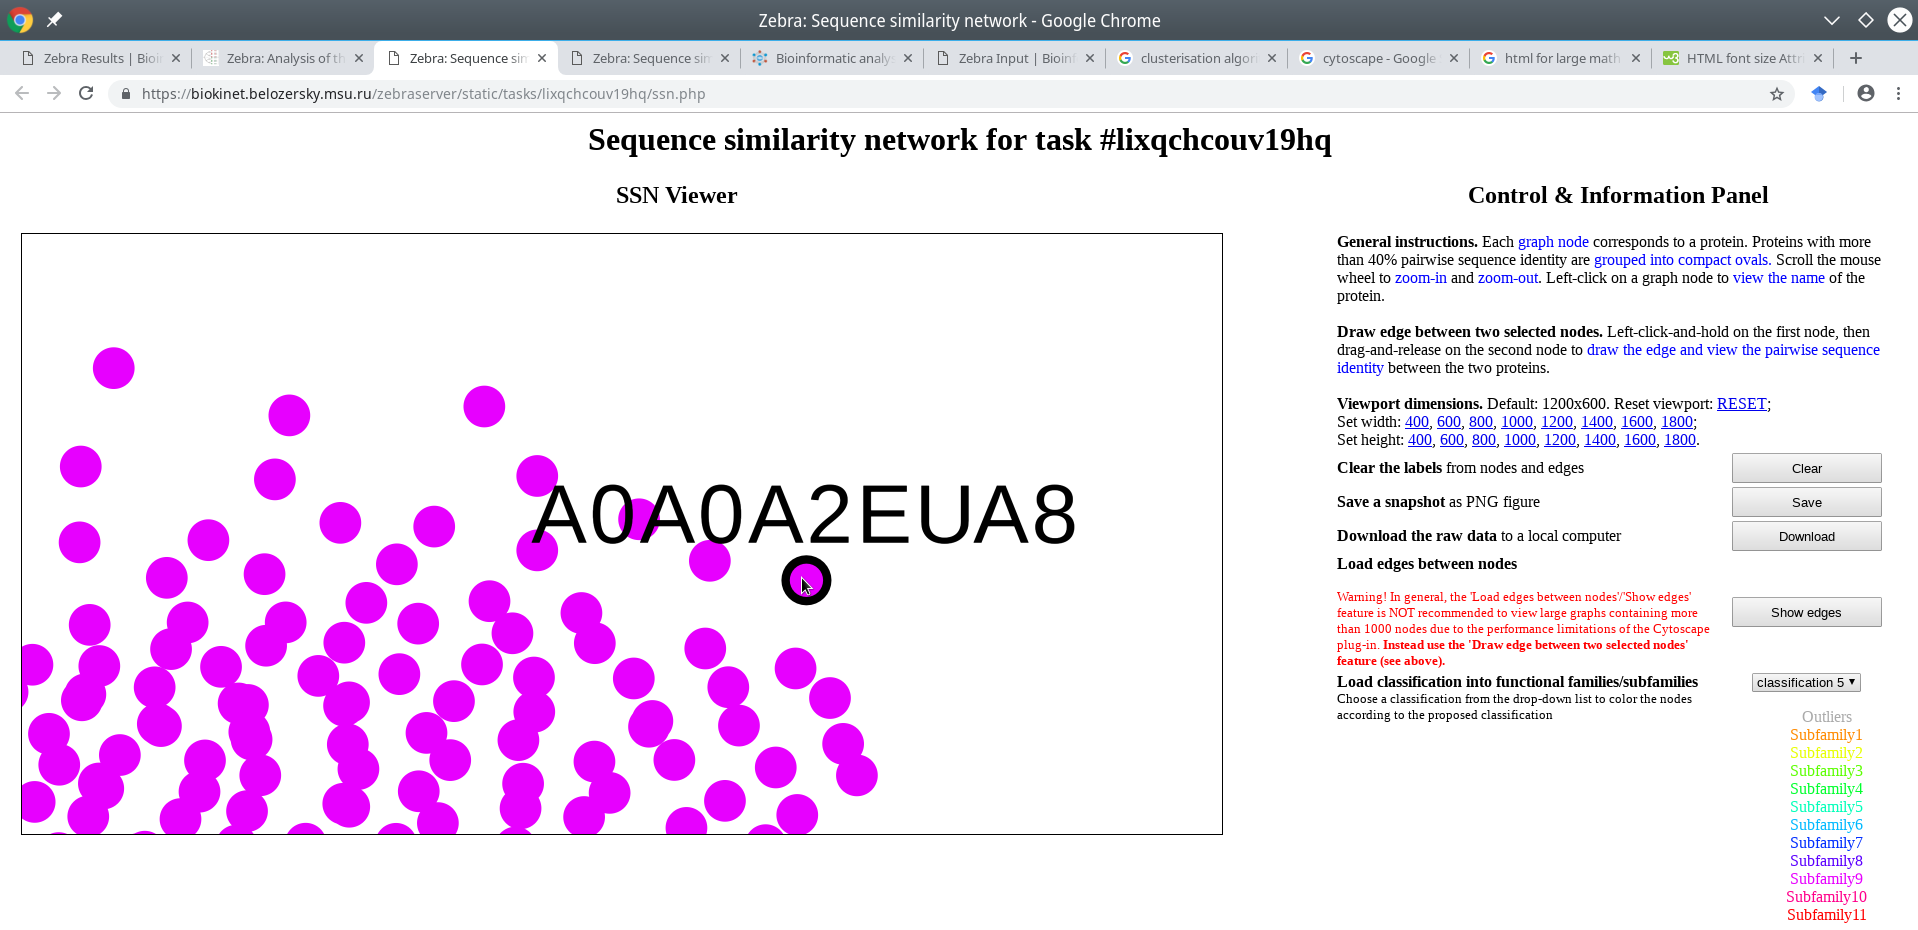
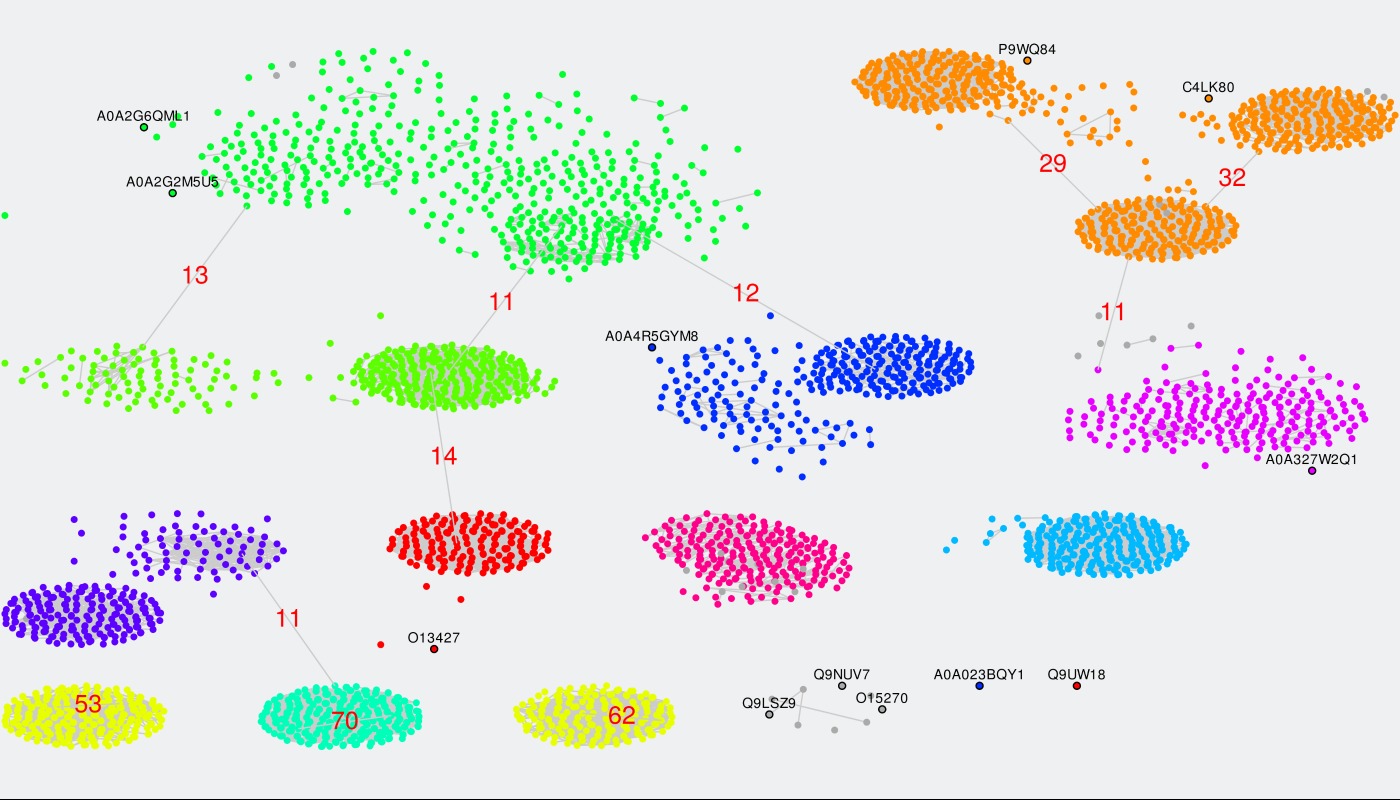
Click on a node to enable its name in the viewport. If the input multiple alignment was prepared by the Mustguseal, then the names of the nodes would be set to the accession numbers of the corresponding proteins in the PDB or UniProt databases. If the input multiple alignment was prepared by the user and the protein naming scheme (i.e., the format of sequence names in the FASTA file) does no comply with the Zebra protein naming rules then the names of the nodes would be set to the actual protein names in the FASTA file truncated to the first 15 characters.
A very useful feature of the SSN viewer is the ability to draw an edge between any two nodes to view pairwise sequence similarity between the corresponding proteins. Left-click-and-hold on the first node, then drag-and-release on the second node to draw the edge and view the pairwise sequence identity (shown in %, rounded to the nearest integer).
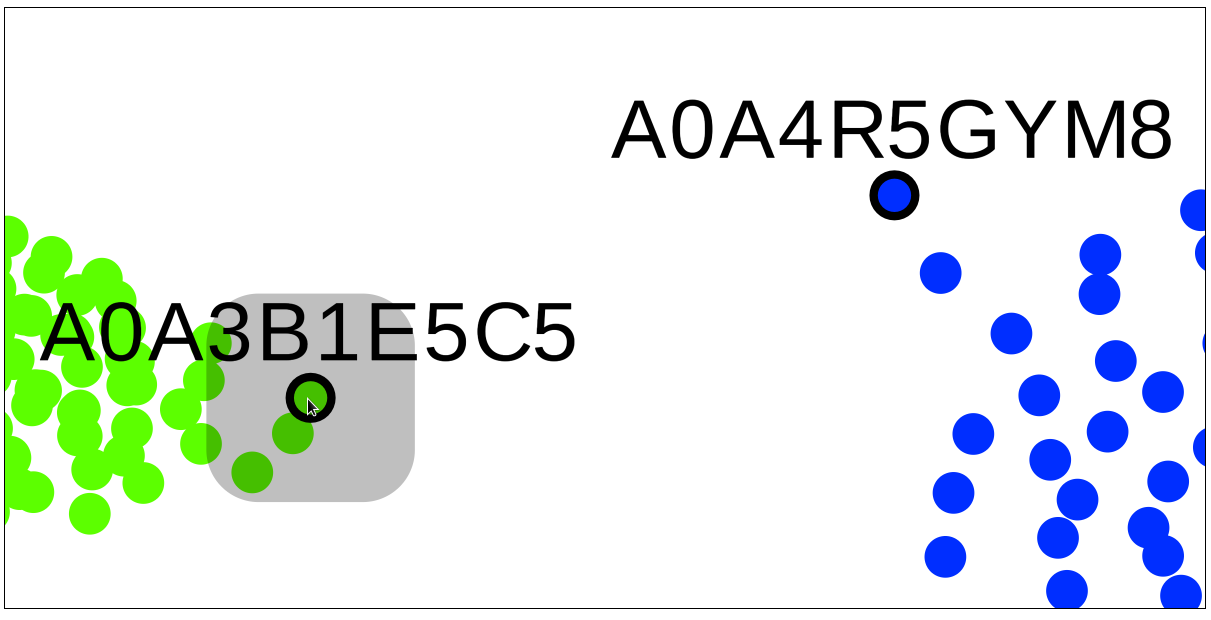
Left-click-and-hold on the first node
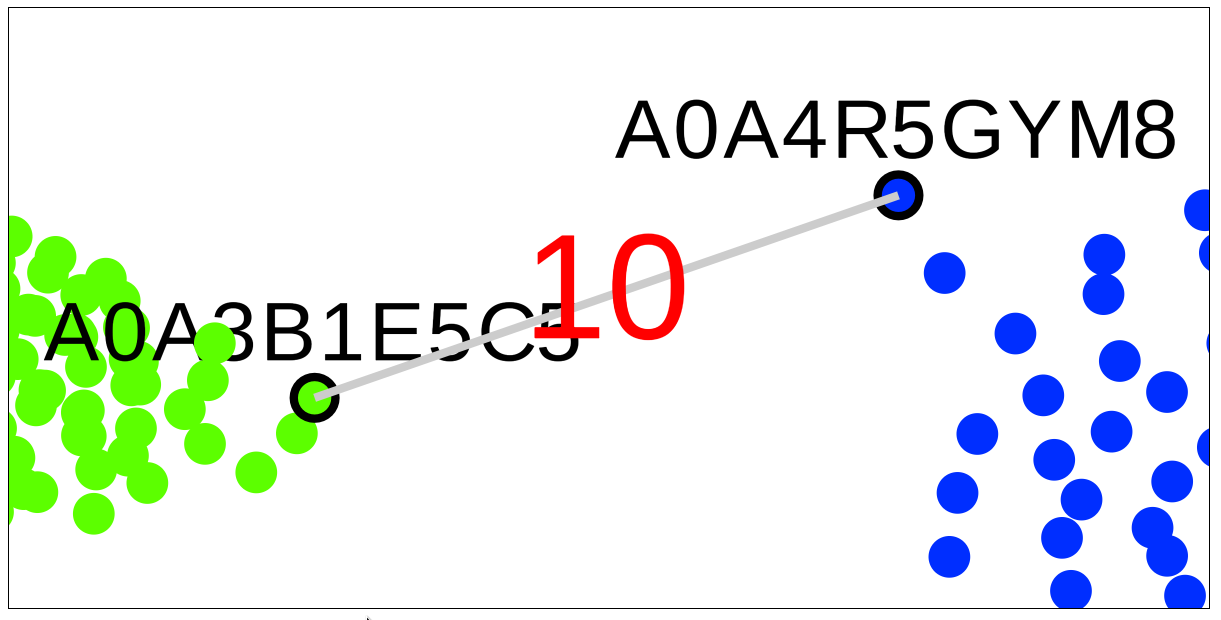
Drag the mouse with the left button put on hold to the second node, then release the left button
You can save a snapshot of the current viewport (i.e., with the color legend applied and all labels visible) in the PNG format to a local computer by pressing the "Save" button on the right side of the page. To clean the viewport from all labels (i.e., node names and edges with weights) press the "Clear" button. The raw data featuring all node names and IDs, subfamily classifications and pairwise distances can be download for local use via the "Download" button.
You can zoom in and out, label nodes and draw selected edges, and then save the annotated sequence similarity network to a file, e.g., to be further used in a presentation or a publication, e.g.:
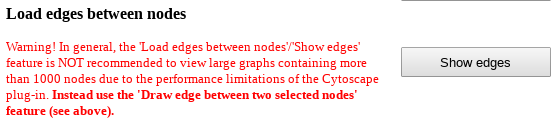
Finally, you can load all edges between nodes within a custom range of pairwise sequence identities between the two proteins. To enable this feature press the "Show edges" button. But before doing so please understand that the Zebra SSN viewer is fast even on large graphs, unless you try to load all edges. By default, nodes are grouped into clusters by sequence similarity and color-coded according to subfamily classification. Thus, generally speaking, loading all pairwise edges would not necessarily add value to the sequence similarity network, but it will significantly slow down your system. Instead of loading all edges you can draw only the selected edges in the SSN viewer to learn the pairwise sequence identity, as that feature is very fast even on large graphs (see above). However, would you still wish to load all edges on large graphs (more than few thousand nodes) for a particular purpose, we recommend Mozilla Firefox browser due to a better performance in benchmark tests.
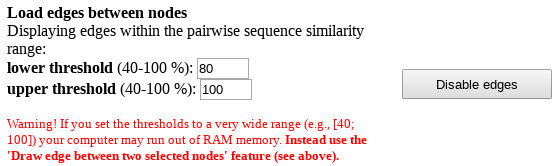
After you press the "Show edges" button all edges between proteins with pairwise sequence identity within 80-100% will be loaded automatically. This part is usually fast. To change the range we recommend to point the mouse pointer into the text box for lower or upper threshold and click, then type in the desired number, and press "Enter" on your keyboard. You may need to press "Wait" or "Continue" button in your browser multiple times during the process to confirm the rendering of the complete scene in the viewport, which may take several minutes to complete. Please understand that if you set the thresholds to a very wide range (e.g., [40; 100]) your computer may run out of RAM memory (depending on the size of the graph, amount of RAM, and system settings). Again, for large graphs containing more than 1000 nodes we recommend to use the 'Draw edge between two selected nodes' feature instead (see above).
You finally annotated sequence similarity network may look like this:
[return to toc]
Levels 2 + 3: Interfaces to sequence-based and 3D-structure-based analysis of conservation and variability
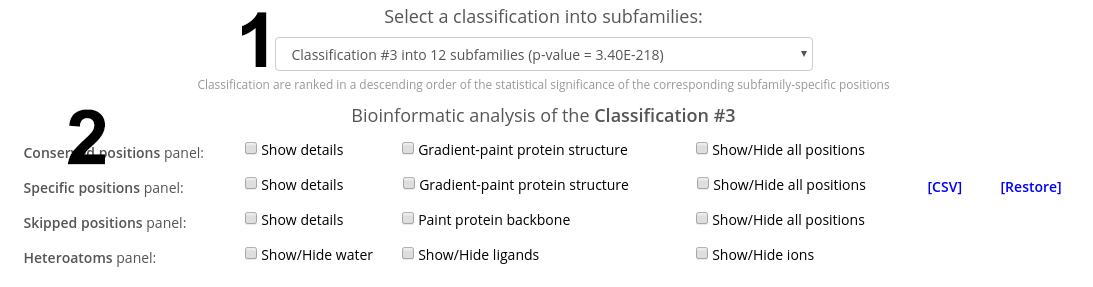
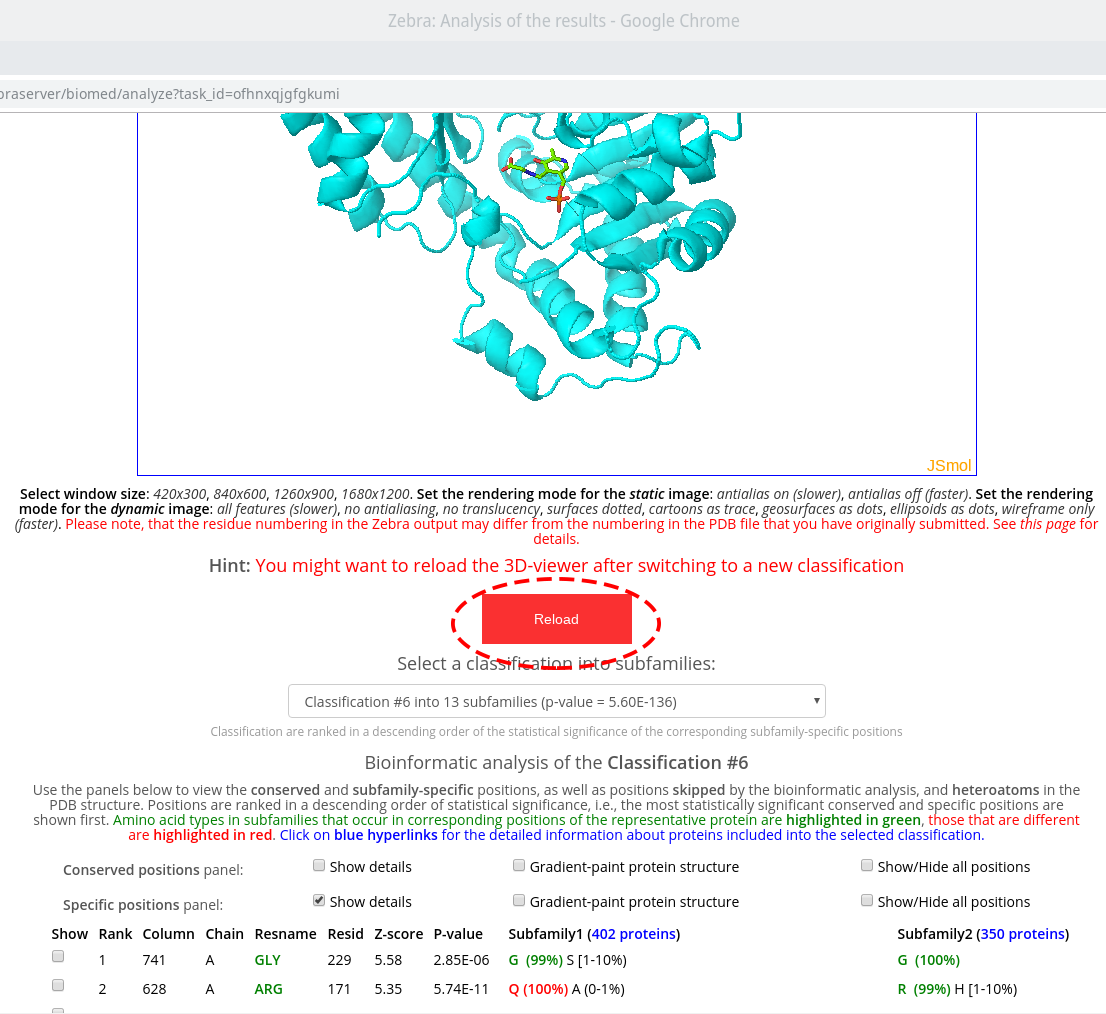
On-line tools for sequence-based and 3D-structure-based analysis provide an interface to study the sequence statistics revealed by the bioinformatic analysis. These tools feature a 3D-viewer and control panels to operate the discovered sequence statistics. The control panels contain a drop-down menu with a list of classifications of proteins into functional subfamilies. By default, these are automatically proposed by the internal Zebra algorithm, and ranked according to the statistical significance of the corresponding subfamily-specific positions, i.e., a classification with the most statistically significant subfamily-specific positions is shown on the top.
First, select a classification in the drop-down menu to load the data for sequence statistics calculated by Zebra for this particular classification. The available options are ranked in declining statistical significance, i.e., the classification with the most statistically significant subfamily-specific positions is shown on the top. For each classification, its #ID in the Zebra output, the number of subfamilies (specificity groups), and the global p-value threshold (i.e., the global minimum) of the corresponding subfamily-specific positions is shown. Second, use the control panel to operate the corresponding sequence statistics and visualize it using the 3D-viewer.
The control panels contain the Conserved positions panel and the Specific positions panel to operate the corresponding residue types, which are the primary objective of this web-server. Please note, that both panels can operate only the most statistically significant positions of each type, i.e., those above (better than) the global statistical significance threshold. The complete list of all columns in the multiple alignment ranked according to their conservation/specificity is available in the Zebra output file, available for download in the Download section of the "Results" page.
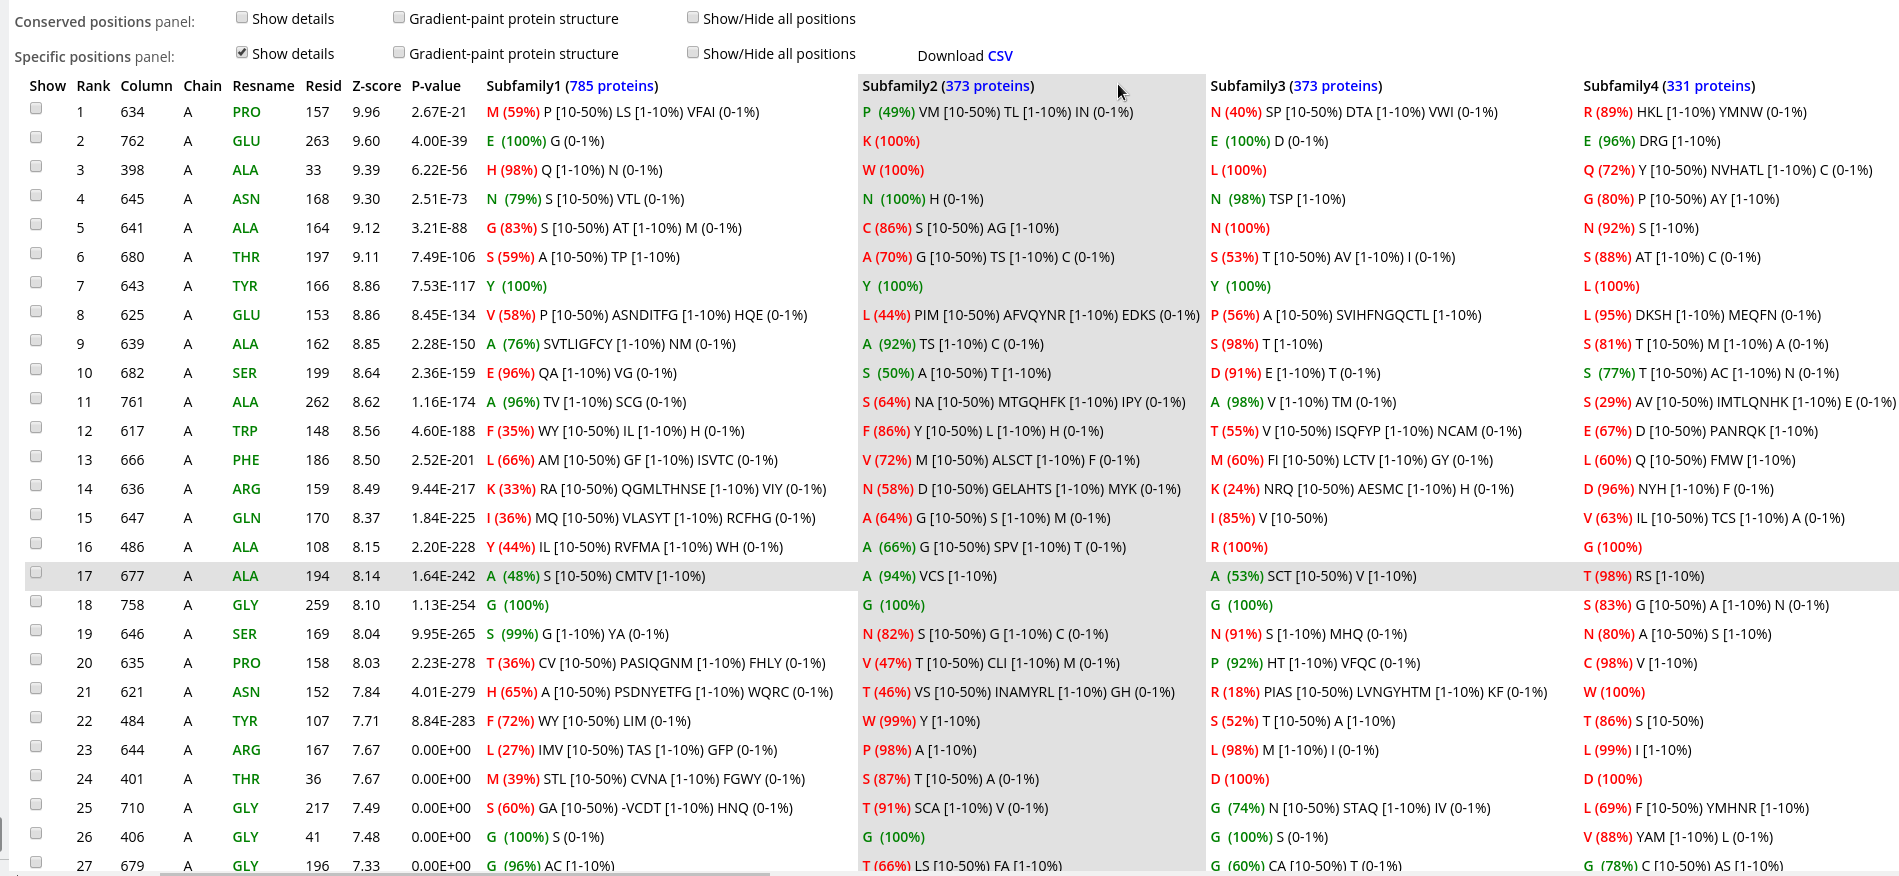
Check the "Show details" checkbox to view the details regarding the selected type of positions for a selected classification. Use the vertical and horizontal scroll bars of your browser to scroll through all subfamilies.
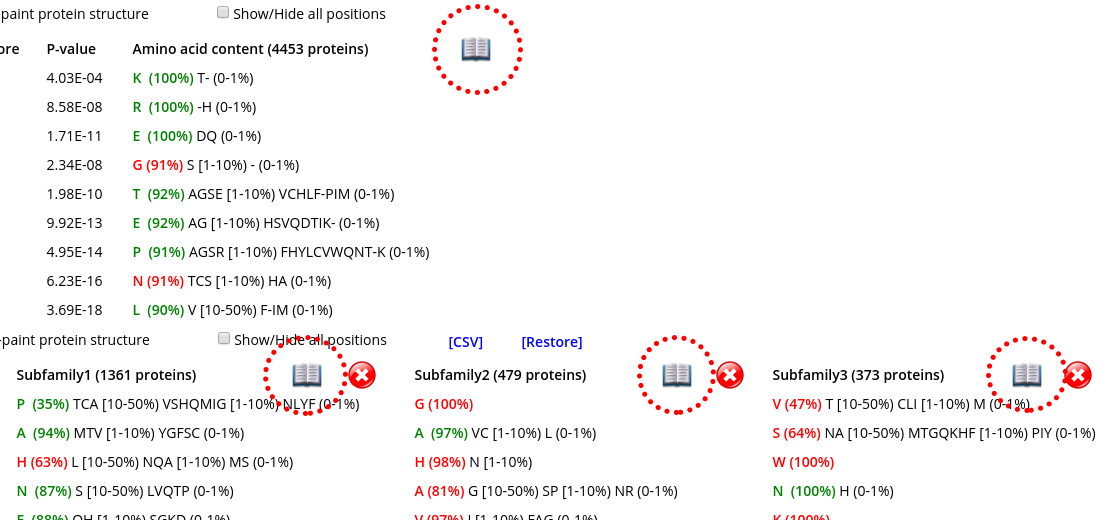
Within each panel, positions are ranked in a descending order of statistical significance, i.e., the most statistically significant conserved/specific positions are shown first. For each position, its statistical rank, place within the multiple alignment (column ID), location in the representative protein structure (chain ID, residue ID, residue name), statistical significance Z-score and P-value are provided. The P-value for position #n estimates the significance of the first n positions, i.e., the P-value corresponds to a set of positions which includes the current position (#n) together with all positions that are statistically more significant then itself (from 1 to n-1). The lowest P-value among all columns in the multiple alignment (i.e., the global statistical significance threshold) automatically highlights a set of the most statistically significant positions of the corresponding type and the selected classification. Finally, amino acid occurrence statistics is provided for each column. In case of the subfamily-specific positions, the amino acid occurrence statistics is provided separately for each specificity group in the selected classification.
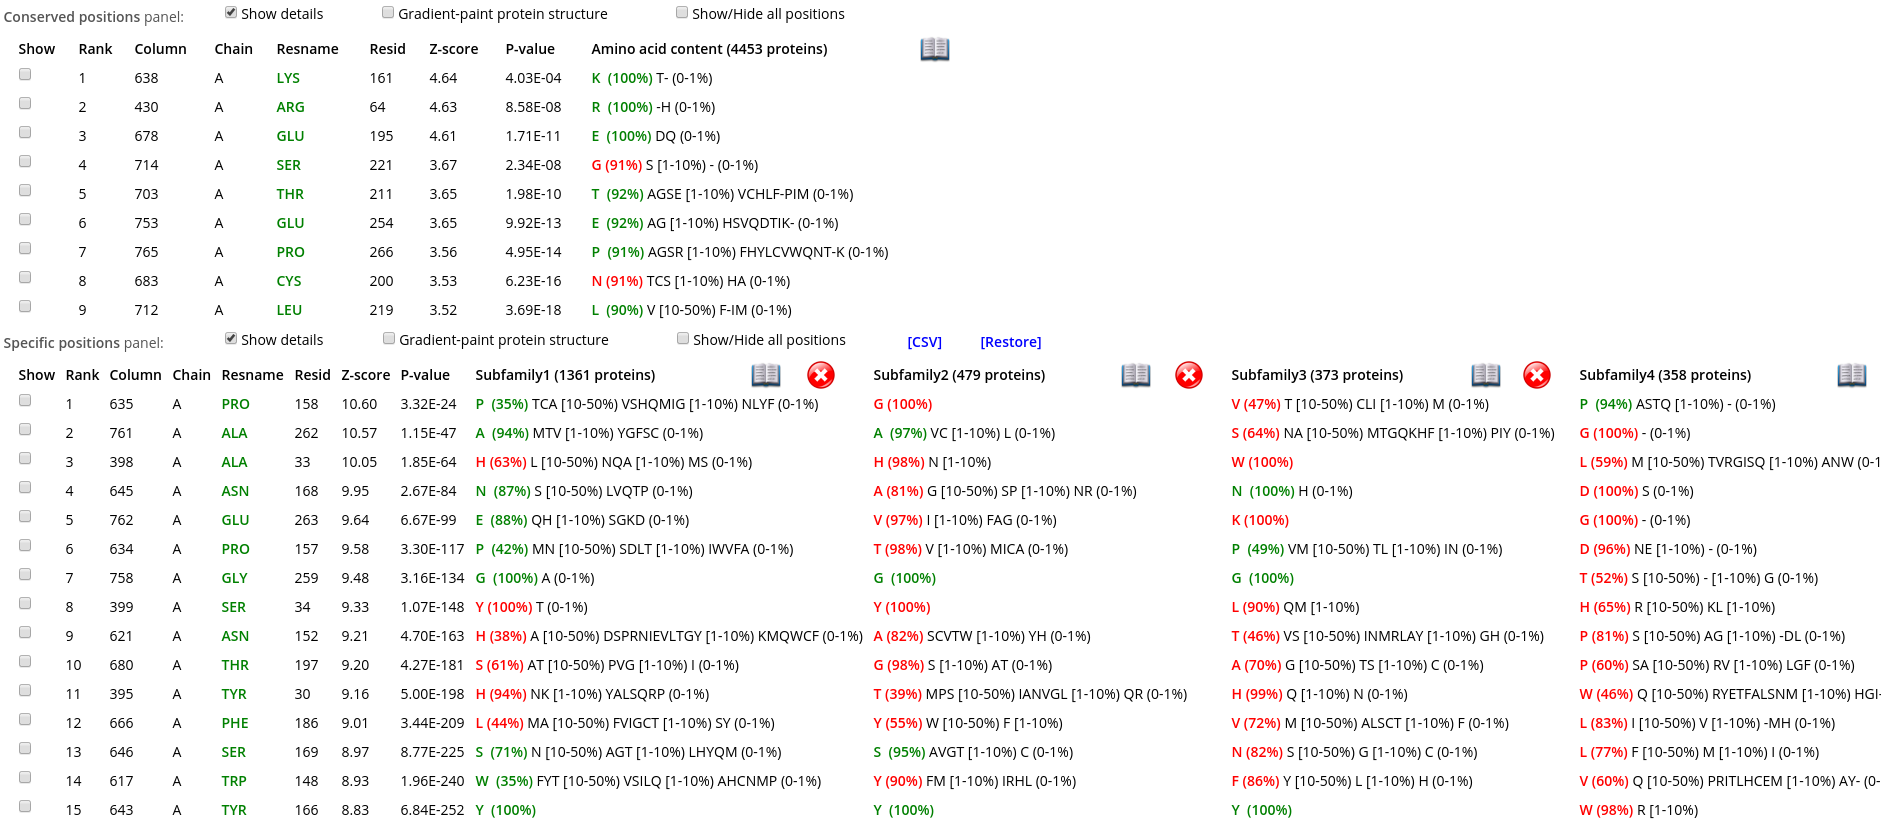
Within each row, amino acid types that occur in corresponding positions of the representative protein are highlighted in green, those that are different are highlighted in red. E.g., in the figure below the specific position with a rank #1 is occupied by proline in the representative protein structure (i.e., A/PRO/158). Then, proline is the most frequent amino acid residue among homologs classified into the Subfamily #1, and thus colored in green P (35%). Finally, the Subfamily #2 contains only glycines (i.e., not prolines, as in the representative protein structure), and thus colored in red as G (100%).

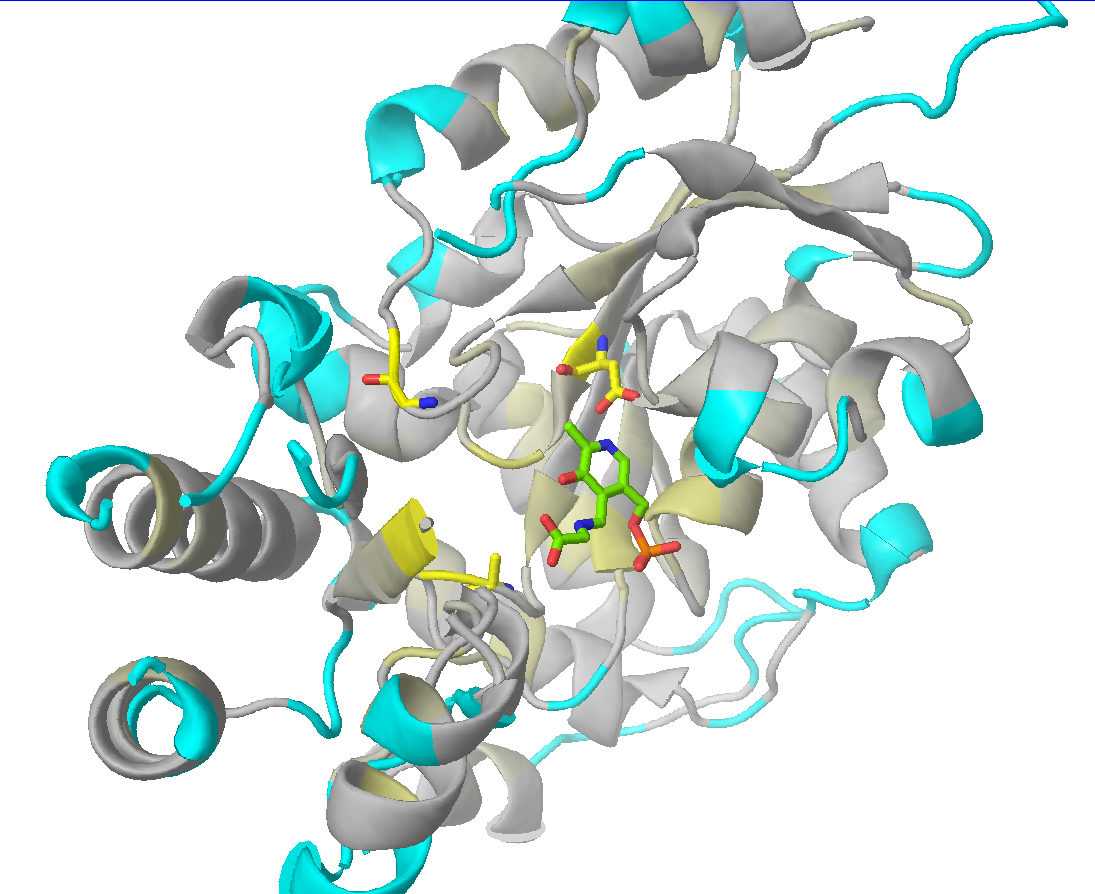
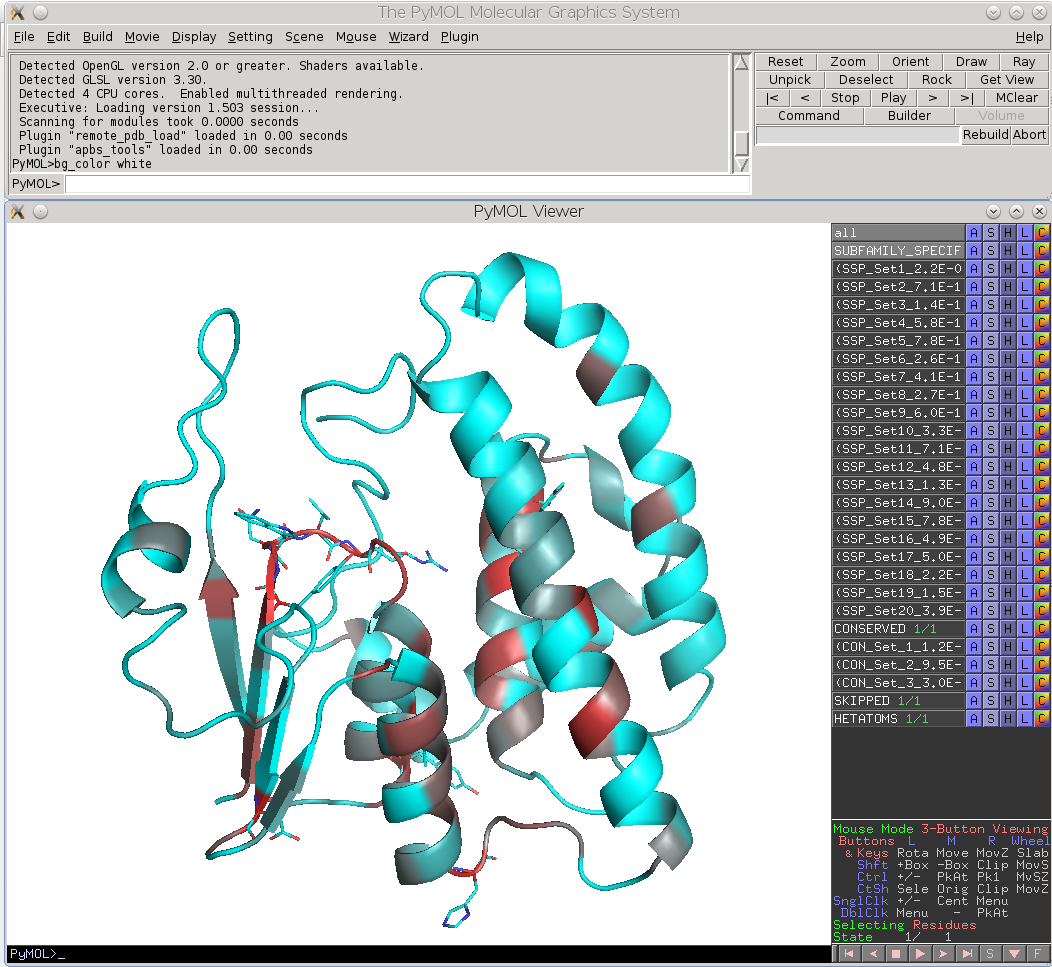
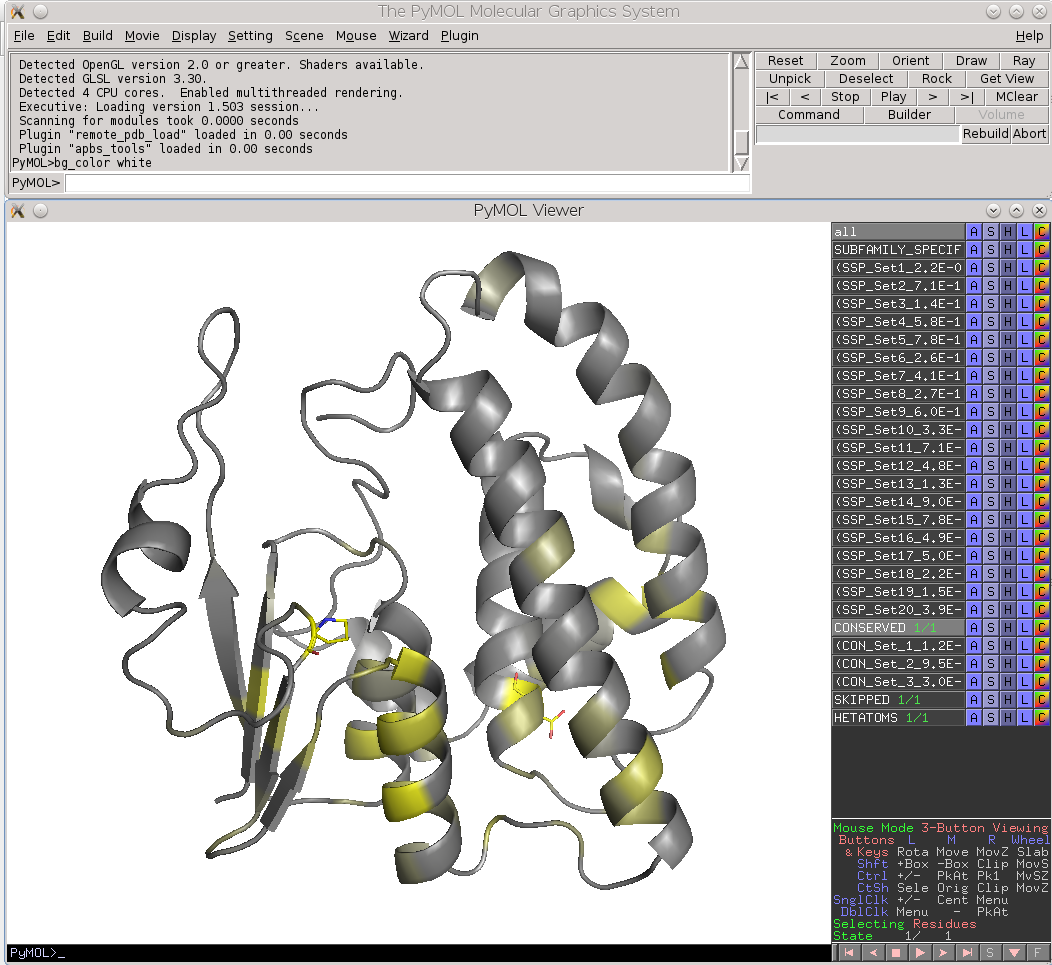
Check the "Show" checkbox at the beginning of each data row to visualize the corresponding residue in the 3D-viewer. You can activate the "Gradient-paint protein structure" feature within each of these panels to gradient-paint the protein backbone in the 3D-viewer according to the statistical significance Z-scores: yellow-to-grey for the conserved positions, with intensive yellow indicating highly conserved positions and grey - non-conserved positions; red-to-cyan for the specific positions, with intensive red indicating highly specific positions and cyan - non-specific positions. In addition, you can activate the "Show/Hide all positions" feature within each of these panels to show the corresponding positions as sticks, with their backbone gradient-pained according to the statistical significance Z-scores, e.g.:
 |
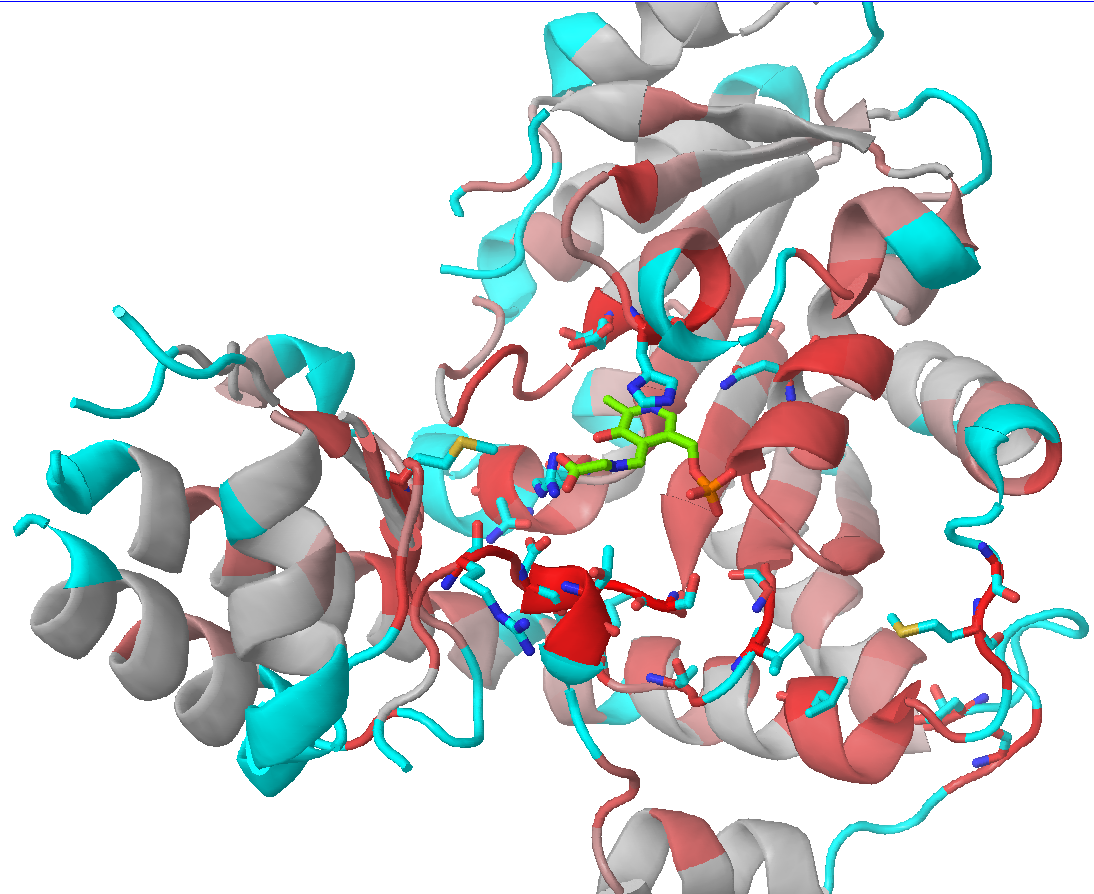 |
| 3D-viewer shows the structure of the representative protein gradient-painted according to sequence conservation, with the most statistically significant conserved positions showed as sticks | 3D-viewer shows the structure of the representative protein gradient-painted according to sequence specificity, with the most statistically significant specific positions showed as sticks |
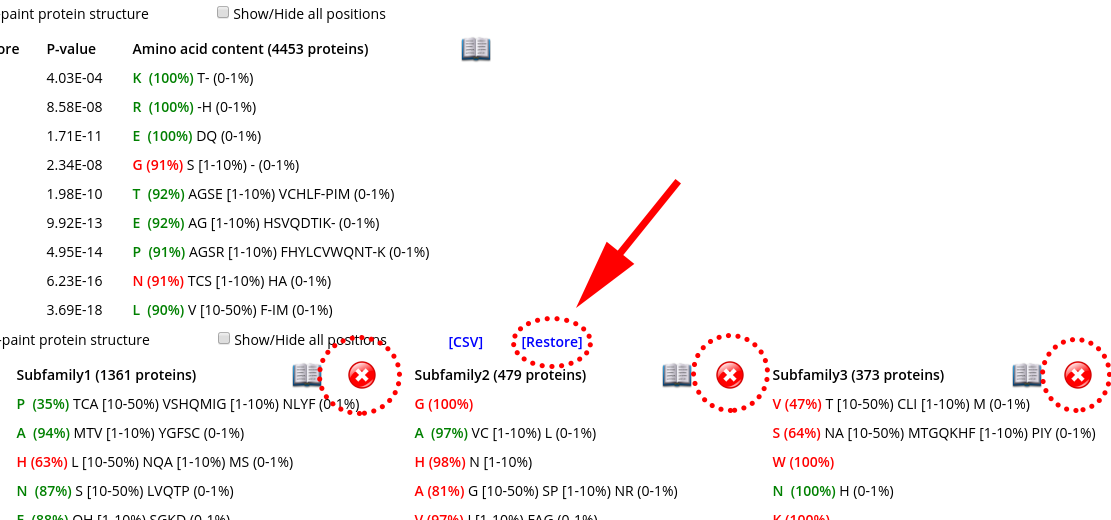
Click on the "cross" icon (![]() ) to remove a subfamily from the table. Press [Restore] to restore all subfamilies. These features can be useful to study large superfamilies with a large number of families/subfamilies, as they allow you to preserve on the selected specificity groups that are the most interesting/informative in the context of your particular study, while temporarily hiding all the others. These features are available only in the "Specific positions panel", as this is the only panel that can contain very wide tables.
) to remove a subfamily from the table. Press [Restore] to restore all subfamilies. These features can be useful to study large superfamilies with a large number of families/subfamilies, as they allow you to preserve on the selected specificity groups that are the most interesting/informative in the context of your particular study, while temporarily hiding all the others. These features are available only in the "Specific positions panel", as this is the only panel that can contain very wide tables.
Another useful feature to study large tables is the column/row highlight. You can highlight a data row representing a position by clicking on any cell, or highlight a column with amino acid content by clicking on its header. To remove the highlighting click on the same item again.
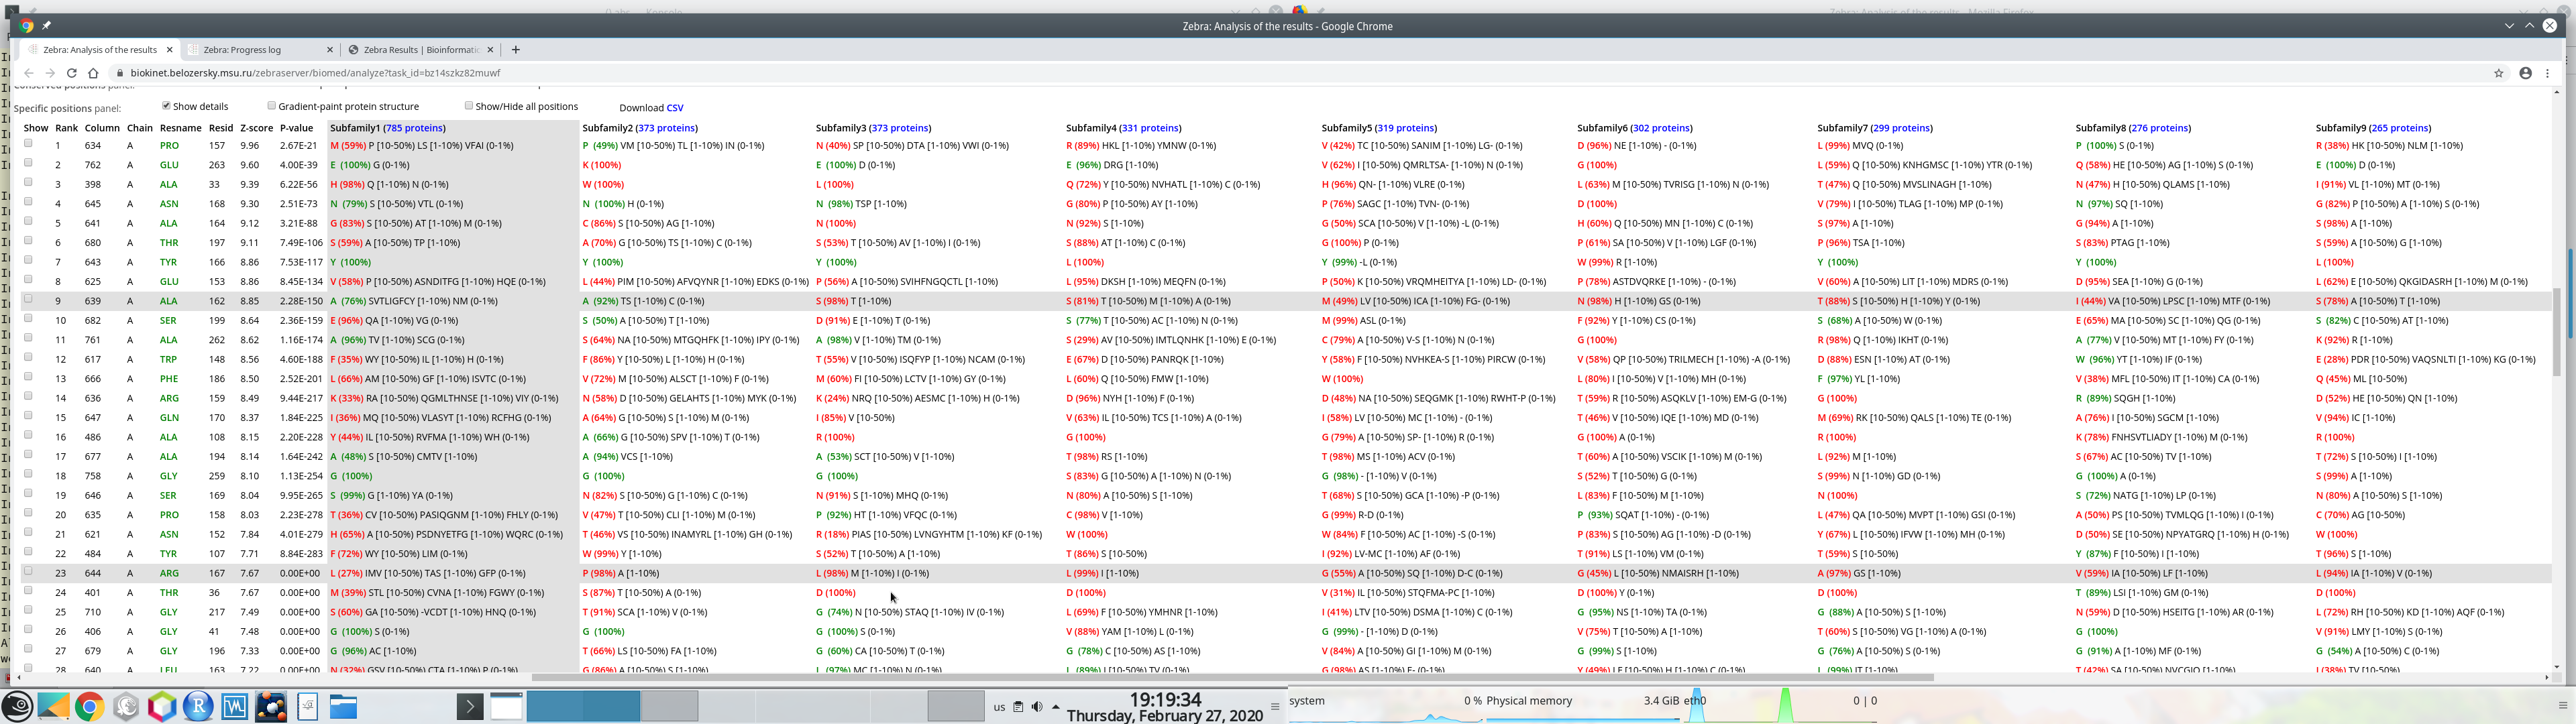
Furthermore, if your PC has two physical monitors, you could resize the browser window manually to fit both devices. This could be convenient to study wide tables with a large number of subfamilies:
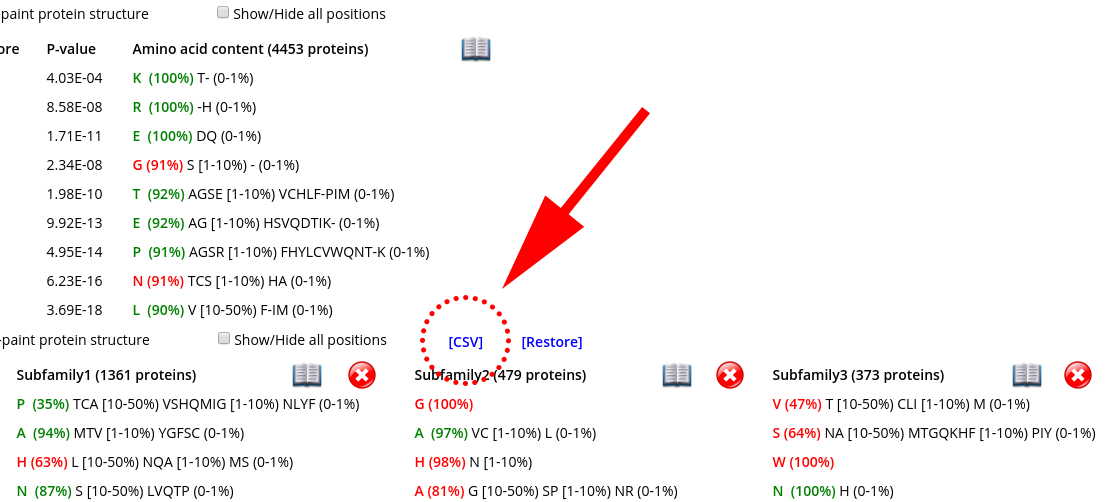
The data table with the selected specific positions, their statistical significance, and amino acid content can be downloaded as a comma-separated-values (CSV) text file. Press the "Download CVS" at the "Specific positions panel":
The sequence statistics is specific to the particular classification into subfamilies/specificity groups. The statistics of the subfamily-specific positions is calculated based on this classification. The statistics of the conserved positions, in generally, should not be significantly different between classifications, although minor changes can occur since different classifications may feature a different number of proteins (i.e., due to a different number of outliers dismissed). Therefore, when you switch to a different classification, you should reset the control panels and the 3D-viewer by pressing the "Reload" button that will appear automatically:
Two auxiliary panels are available. The Skipped positions panel operates the amino acid residues that correspond to the columns in the multiple alignment that were skipped by the bioinformatic analysis due to high content of gaps or/and if explicitly dismissed by the user in the "Select columns by ..." mode (see the selection of positions for bioinformatic analysis in the Parameters section). Such columns will be painted in white on the representative protein PDB structure.
Finally, the Heteroatoms panel operates the ligands and ions in the representative protein PDB structure.
[return to toc]
Level 4: Detailed annotation of proteins with links to the external resources (i.e., PDB, Uniprot, BacDive, BRENDA)
For each protein in the multiple sequence alignment a detailed information is loaded from UniProt/PDB databases to complement the presentation of the results discussed above. For this feature to work, the protein naming scheme (i.e., the format of sequence names in the FASTA file) should comply with a certain standard. If the input multiple alignment was prepared by the Mustguseal, the correct protein naming scheme is applied automatically. If the input multiple alignment was prepared by the user then the correct naming of proteins is responsibility of the user. Please consult this page for details of the Zebra protein naming rules.
Click on the "open book" icon (![]() ) to access the annotation page for the complete set of proteins (within the Conserved positions panel) or for the selected subfamily (within the Specific positions panel):
) to access the annotation page for the complete set of proteins (within the Conserved positions panel) or for the selected subfamily (within the Specific positions panel):
Clicking on such links will open the corresponding details in a separate tab, e.g.:
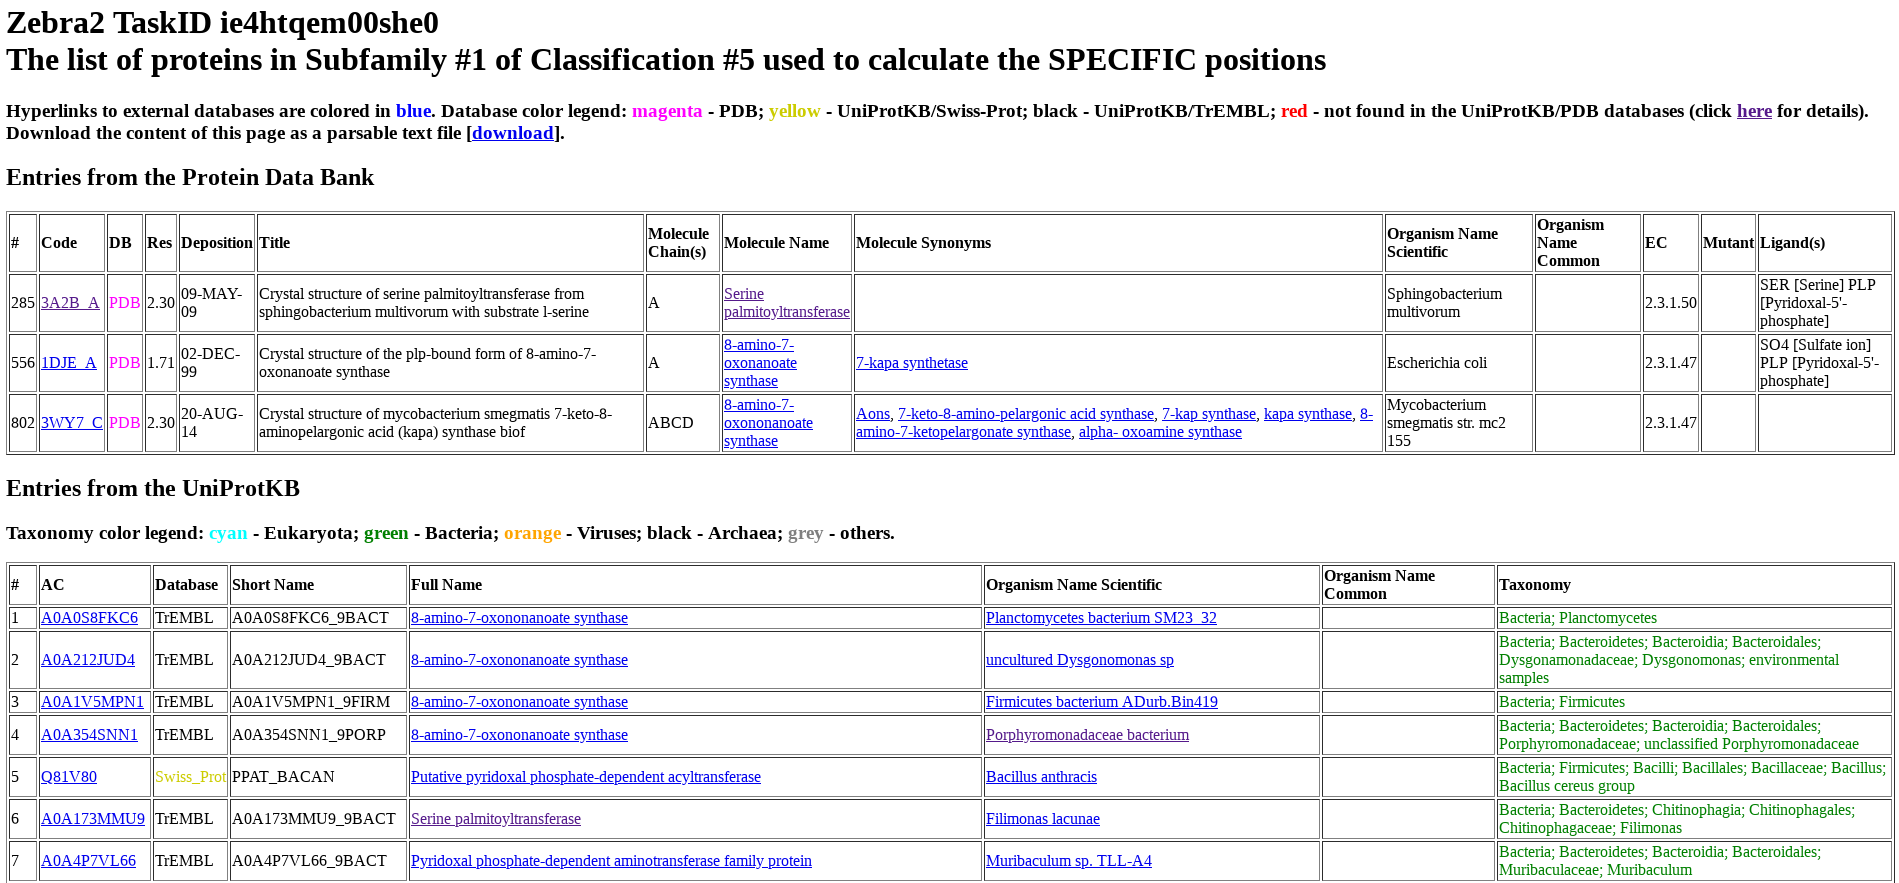
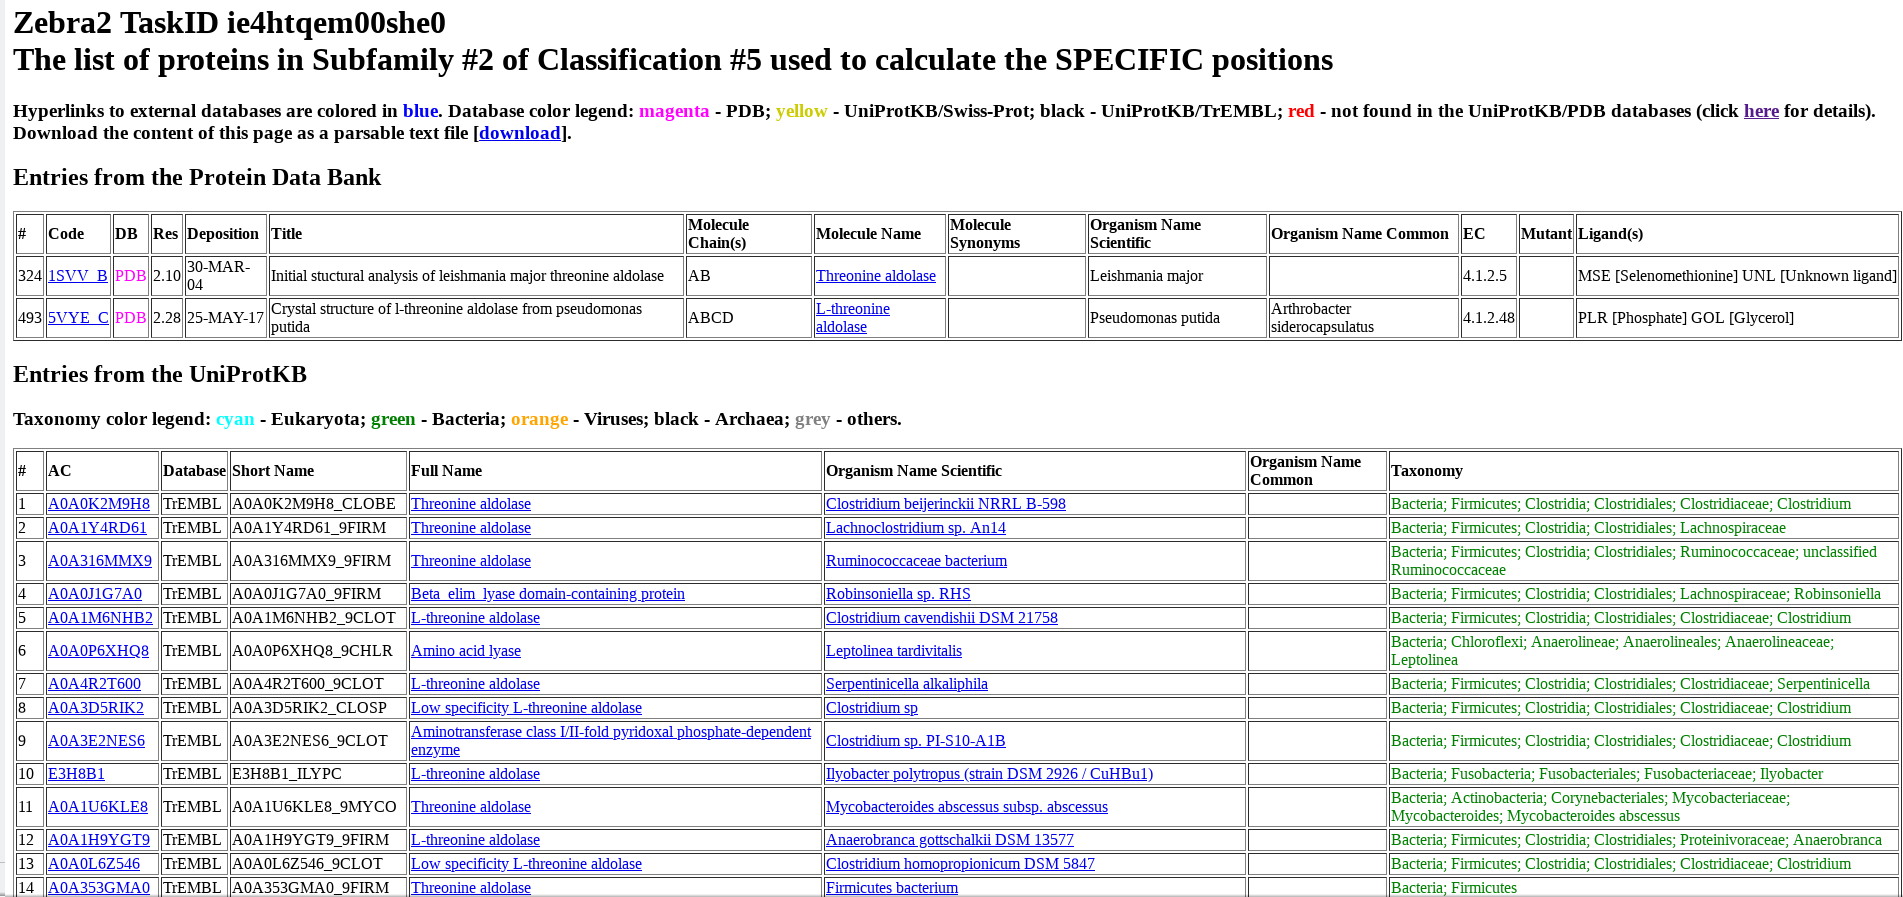
Protein from PDB and UniProt are listed separately and numbered (i.e., ranked) as they appear in the input multiple alignment. For each protein, its accession number in UniProt or PDB, name, organism, taxonomy, and other database-specific details are provided. The accession number includes a hyperlink to the corresponding database (i.e., UniProt or PDB). The protein name includes a hyperlink to the BRENDA Comprehensive Enzyme Information System. For proteins from bacterial sources, the organism name includes a hyperlink to the BacDive database (Bacterial Diversity Metadatabase).
[return to toc]
Download section
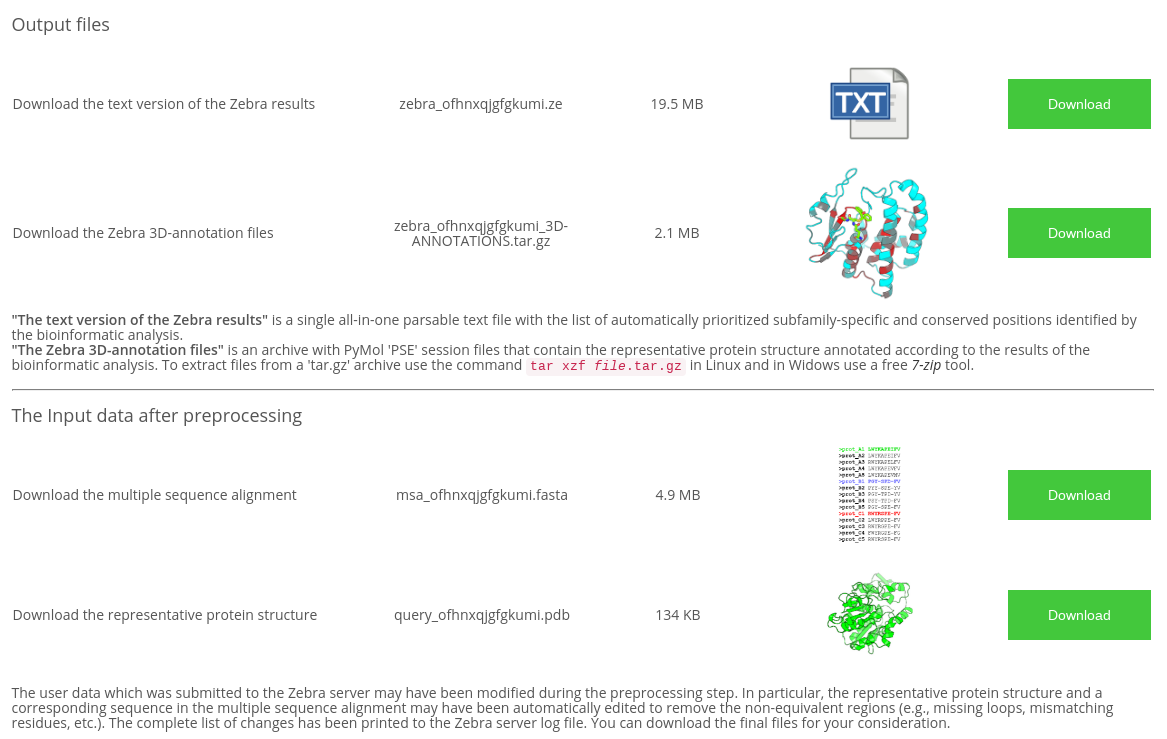
This section provides download links to the results of the Zebra bioinformatic analysis: the text file with list of automatically prioritized subfamily-specific and conserved positions, as well as 3D-annotations of the selected positions onto the representative protein structure.
The Download section also features the download links to the updated input files that are actually being used by the web-server to run the analysis. The user data which was submitted to the Zebra server may have been modified during the preprocessing step. In particular, the representative protein structure and the corresponding sequence in the multiple sequence alignment may have been automatically edited to remove the non-equivalent regions (e.g., missing loops, mismatching residues, etc.). The complete list of changes has been printed to the Zebra server log file. You can download the final files for your consideration.
The single all-in-one parsable text file includes the complete description of conservation and variability in the input multiple alignment, and presents a valuable source of information.
This output text file contains the following data:
- List of subfamily classifications ranked in declining statistical significance (if the automatic classification by the Zebra internal algorithm was used);
- For every subfamily classification (can be more than one if classifications we proposed automatically by Zebra internal algorithm):
- List of predicted conserved positions ranked in declining statistical significance, with a detailed description of the statistical evaluation and amino acid content of the corresponding columns;
- List of predicted subfamily-specific positions ranked in declining statistical significance, with a detailed description of the statistical evaluation and amino acid content of the corresponding columns;
The Zebra output text file can be used independently without the need for cross-reference with the original MSA. It is a plain text file which contains context-specific headers (keywords) at the beginning of each line for easy parsing using command-line tools and simple editors and can thus be integrated into automatic pipelines. Details are provided below.
The Zebra output text file has the following structure: for each subfamily classification a list of corresponding conserved positions, followed by the a list of subfamily-specific positions is provided. The text file is concluded by a summary of subfamily classifications ranked in declining statistical significance of the subfamily-specific positions they produce. Generally speaking, when working the text version of Zebra output we recommend starting from the end of the file (i.e., the summary of subfamily classifications) to learn the ID of the most significant classification. Then, you should jump to this selected classification first to view the corresponding lists of positions. Detailed explanation is provided below.
When working with both the web-version and the text version of the output it is important to understand the following points:
- Classifications are entitled "Classification" in the web-version and "RUNC" in the text file, e.g., Classification #3 and RUNC3;
- In the web-version, classification ARE RANKED in declining statistical significance, e.g., the best "Classification #3" is loaded by default, and others can be selected from the drop-down list. In the text-version, classifications ARE NOT RANKED and instead printed in sequential order, e.g., "RUNC1", "RUNC2", "RUNC3", and their ranking is provided at the bottom of the text file. See details below.
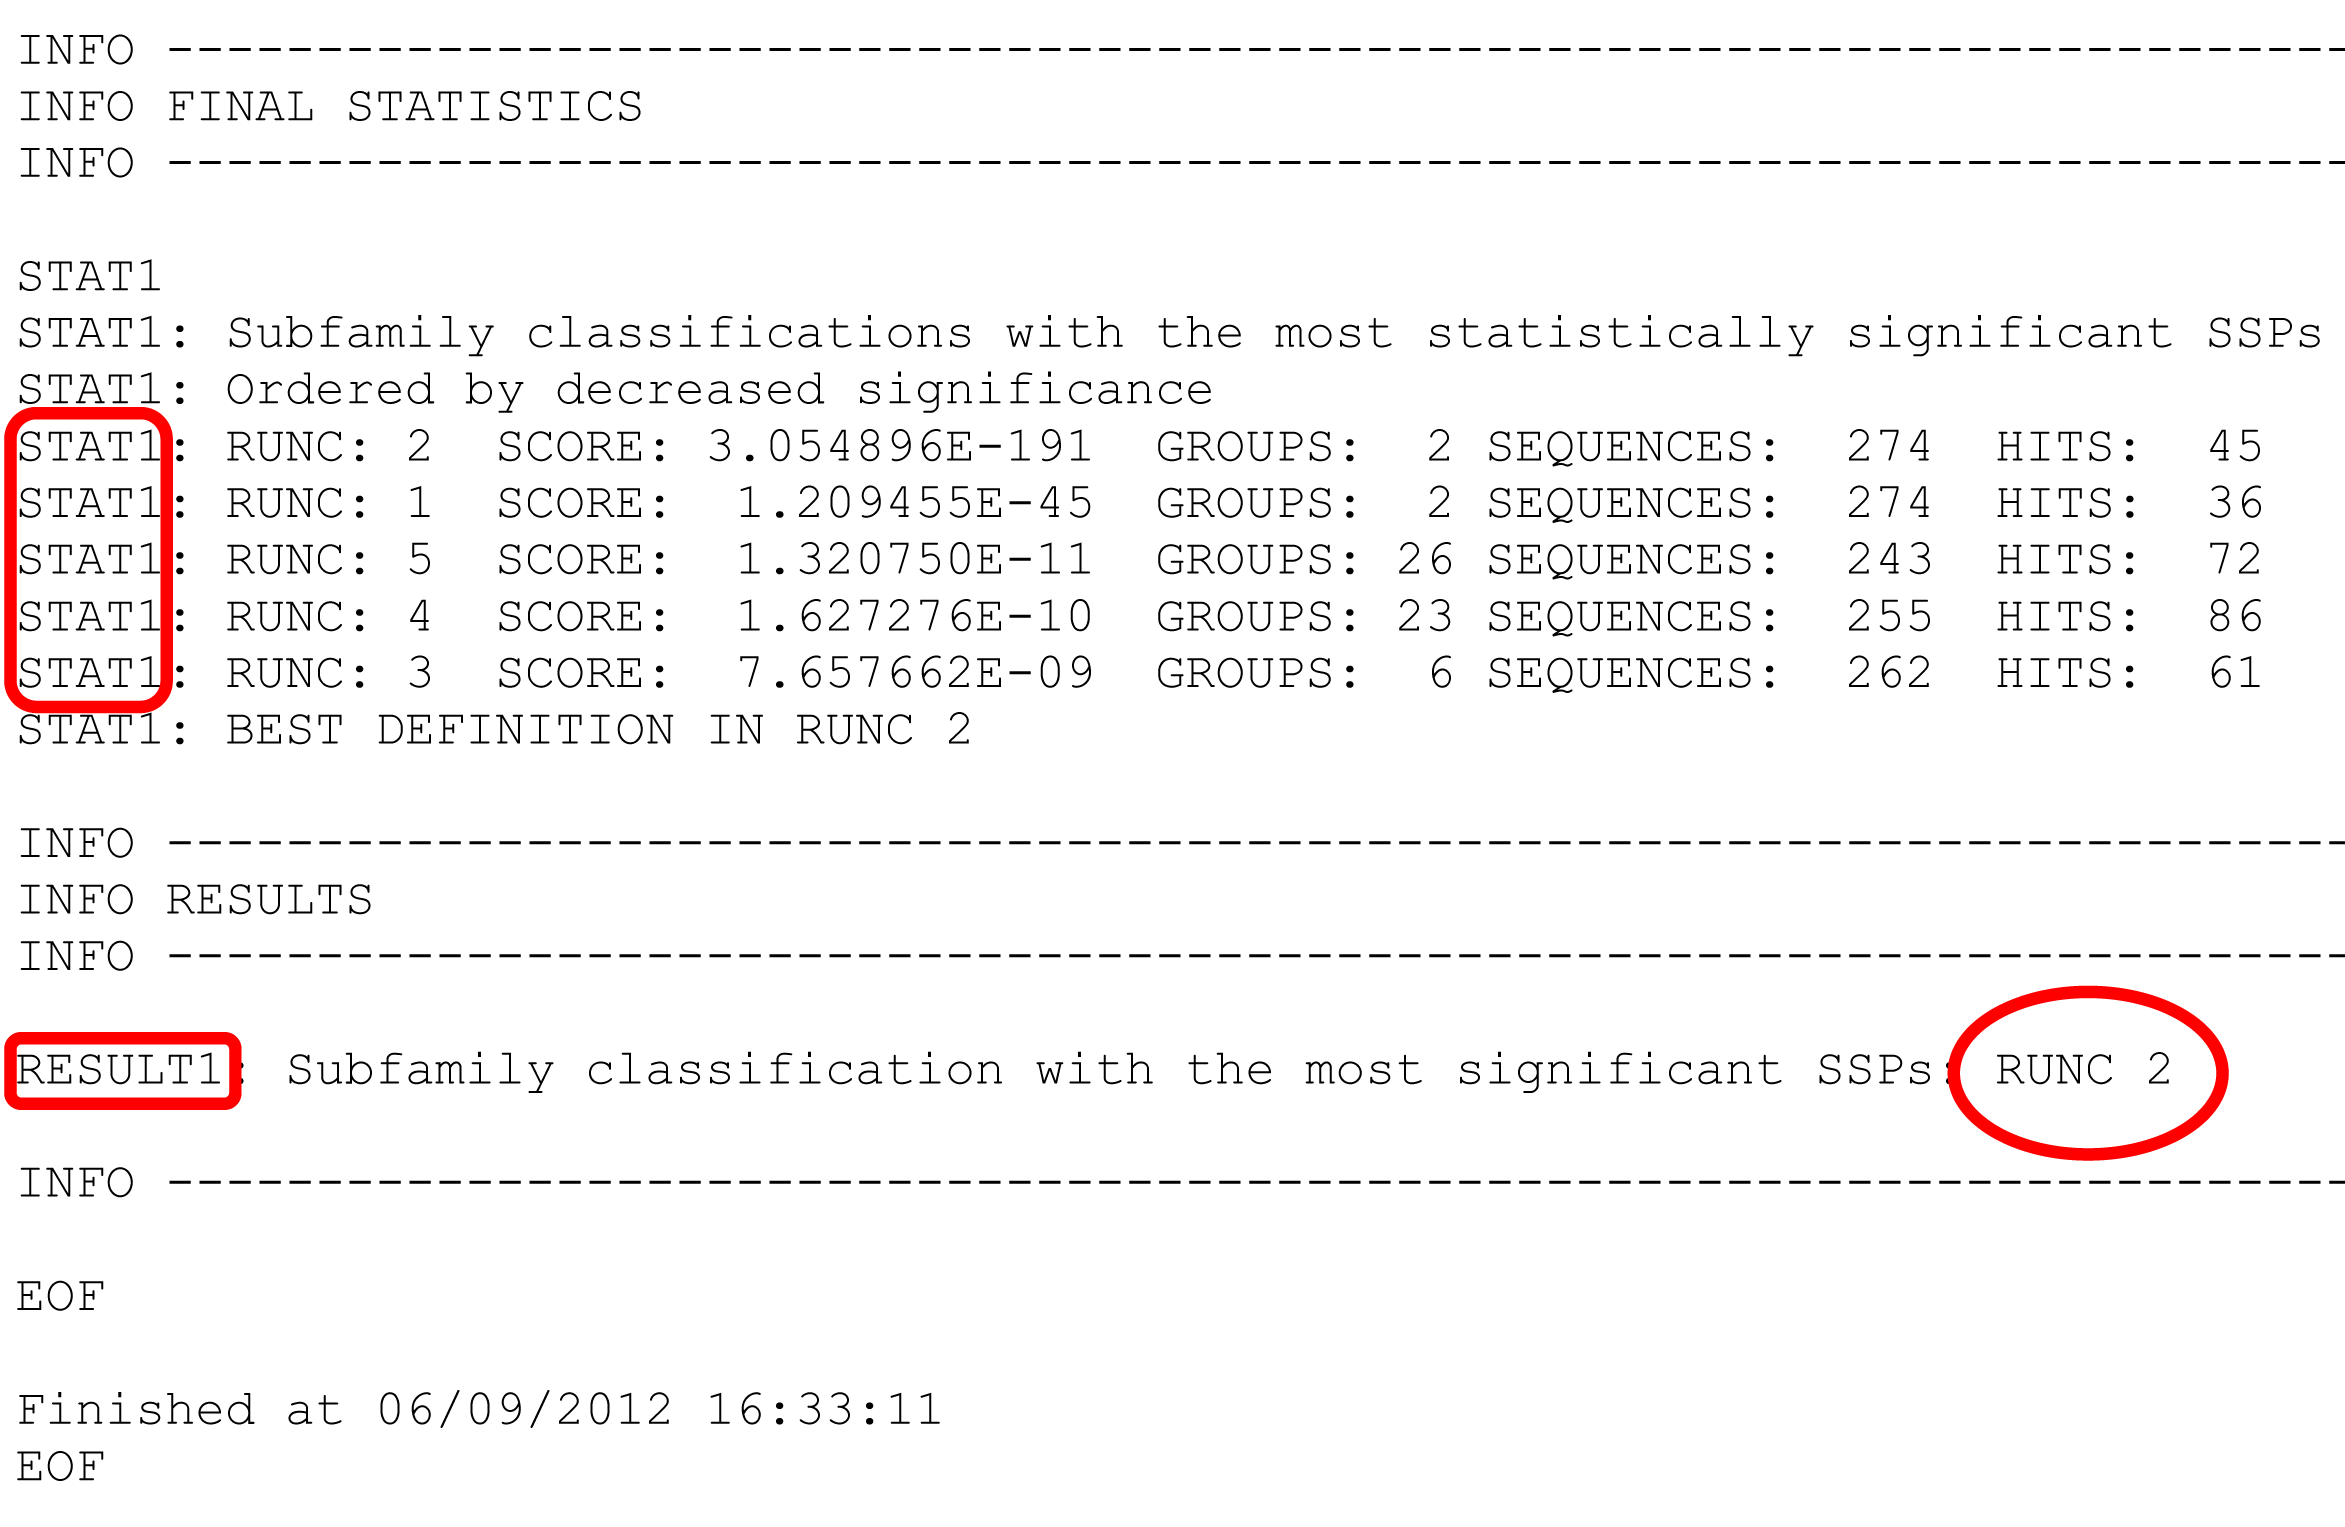
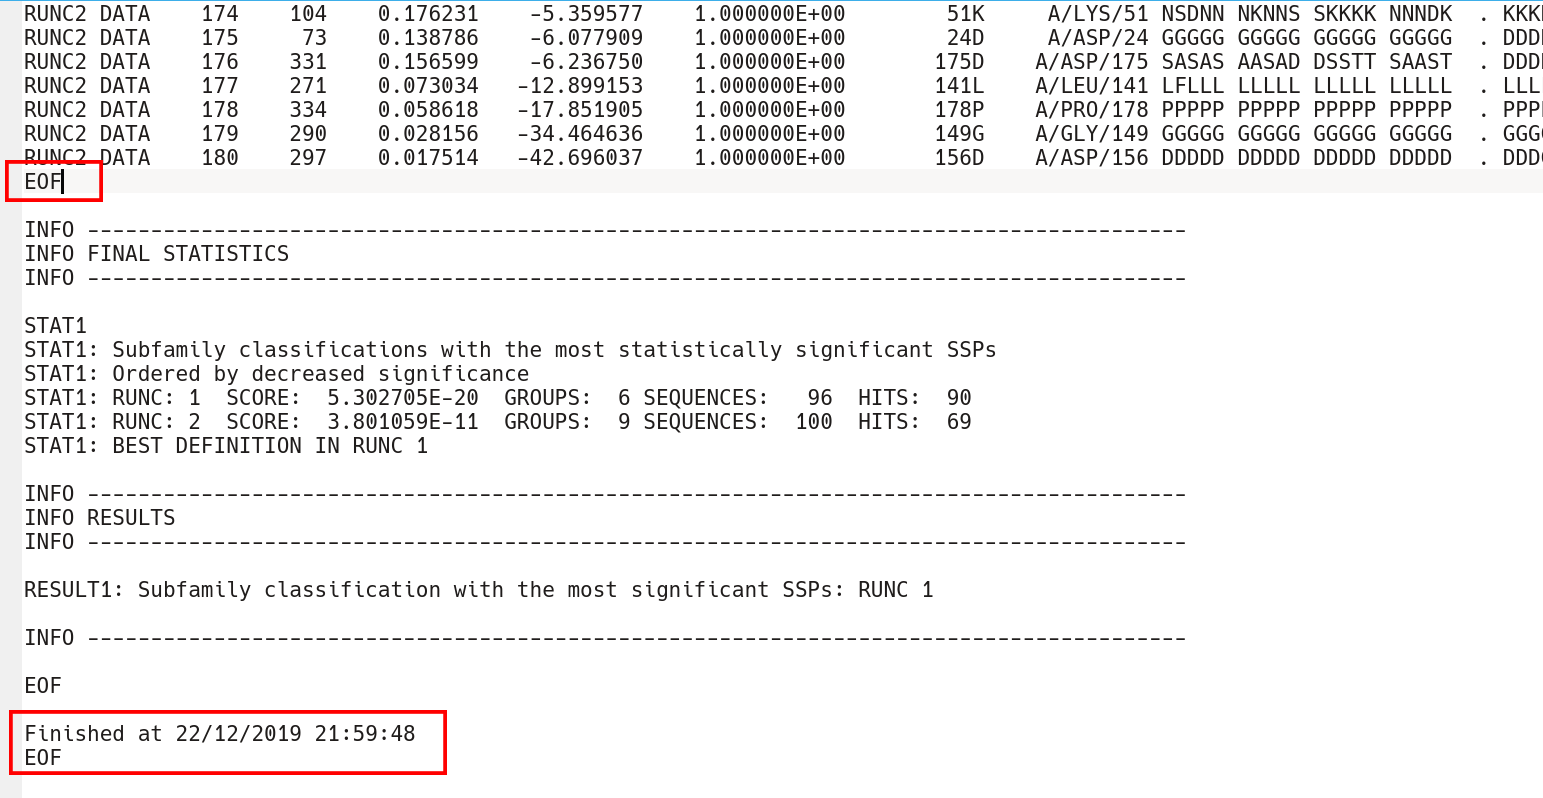
STAT1 keyword at the very end of the text file describes ranking of subfamily classifications by significance of the subfamily-specific positions they produce. Each subfamily classification is named RUNC[X] where RUNC stands for "RUN Classification" and [X] refers to ID of a subfamily classification. The ID of the "best" top-ranking subfamily classification is once again stated under the RESULTS1 keyword.
Now we return to the top of the text file.
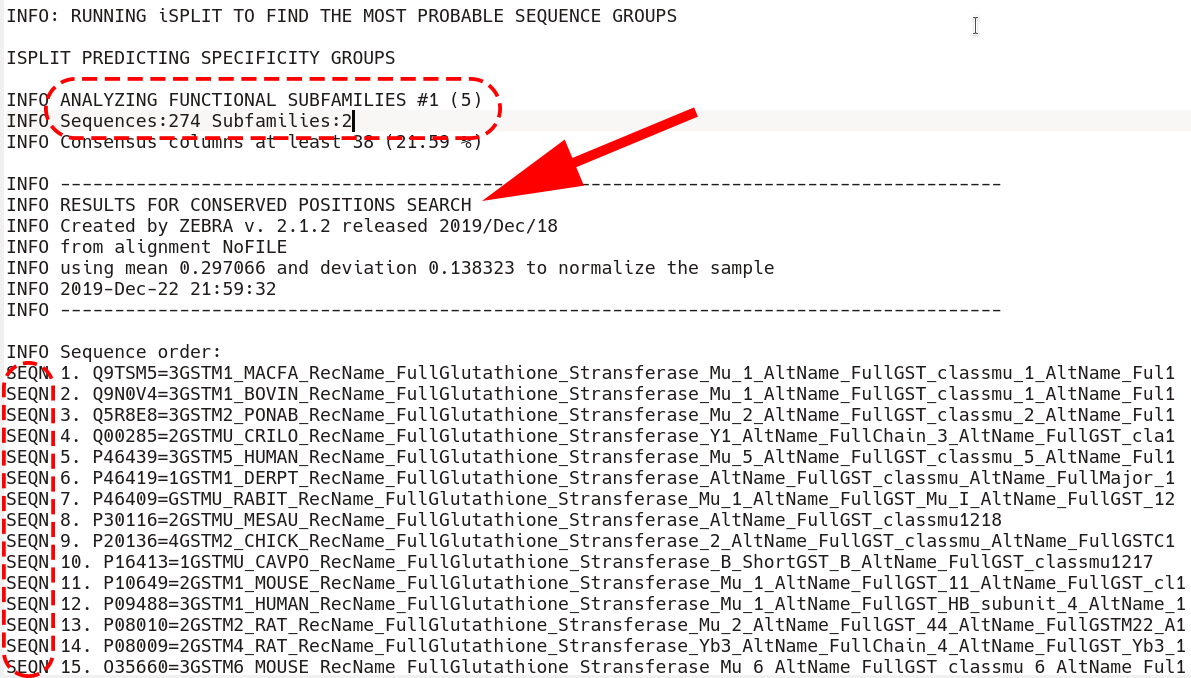
First, all sequences are listed as they appear in the input multiple alignment. Then, the first subfamily classification is loaded starting from the phrase "ANALYZING FUNCTIONAL SUBFAMILIES #1 (5)"
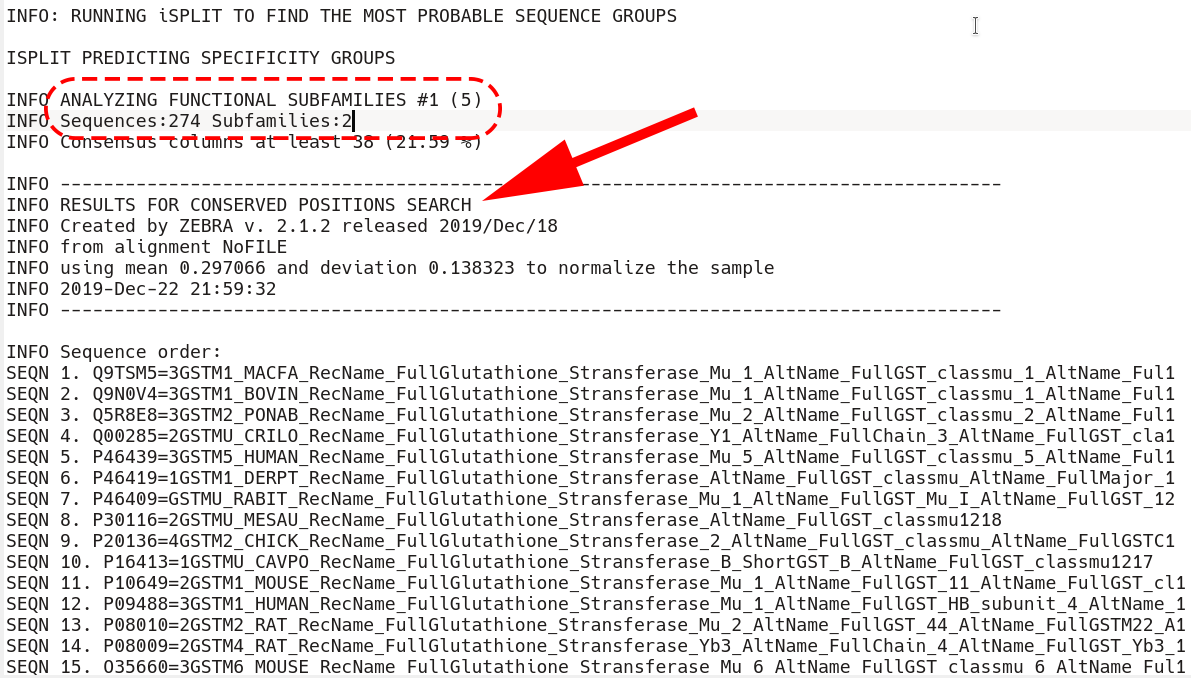
Immediately after that section is the beginning of the conserved positions section. First, all sequences that are included into the classification are listed by the SEQN keyword (i.e., the outliers are excluded, if applicable)
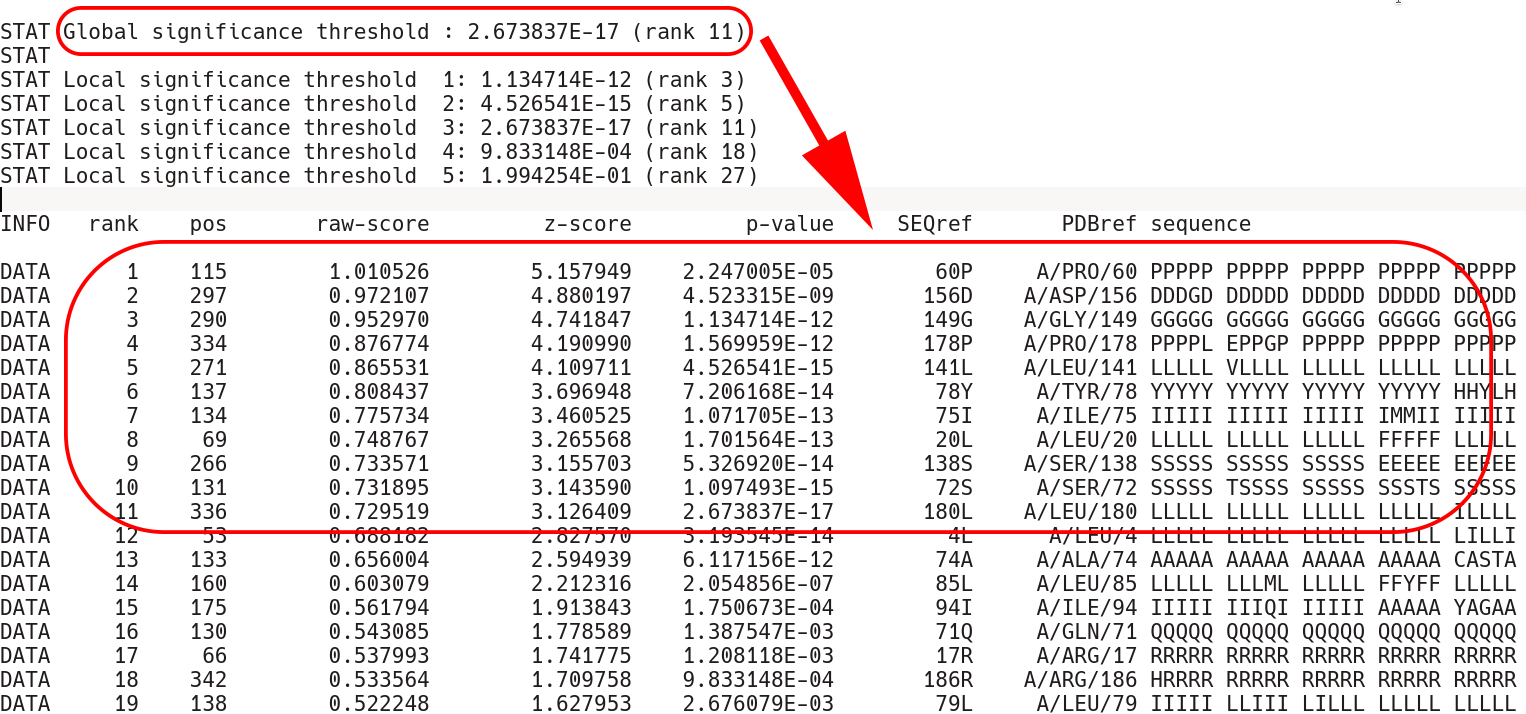
Second, comes the sequence statistics for the conserved positions. These are listed in declining statistical significance. The STAT keyword provides a summary of all P-value thresholds, global and local, see below. The DATA keyword provides the following information for each position (i.e., a column in the input multiple alignment): its statistical rank (rank), column ID (pos), statistical evaluation details (raw-score, z-score, p-value), the corresponding amino acid residue in the representative protein (SEQref - in the sequence, PDBref - in the 3D-structure), and the complete amino acid content of the column. The P-value for position #n estimates the significance of the first n positions, i.e., the P-value corresponds to a set of positions which includes the current position (#n) together with all positions that are statistically more significant then itself (from 1 to n-1). The lower P-value of column #n followed by a higher (i.e., poorer) P-value of column #n+1 defines a local statistical significance threshold. The lowest P-value among all columns in the multiple alignment defines the global statistical significance threshold. The lowest P-value among all columns in the multiple alignment (i.e., the global statistical significance threshold) automatically highlights a set of the most statistically significant conserved positions.
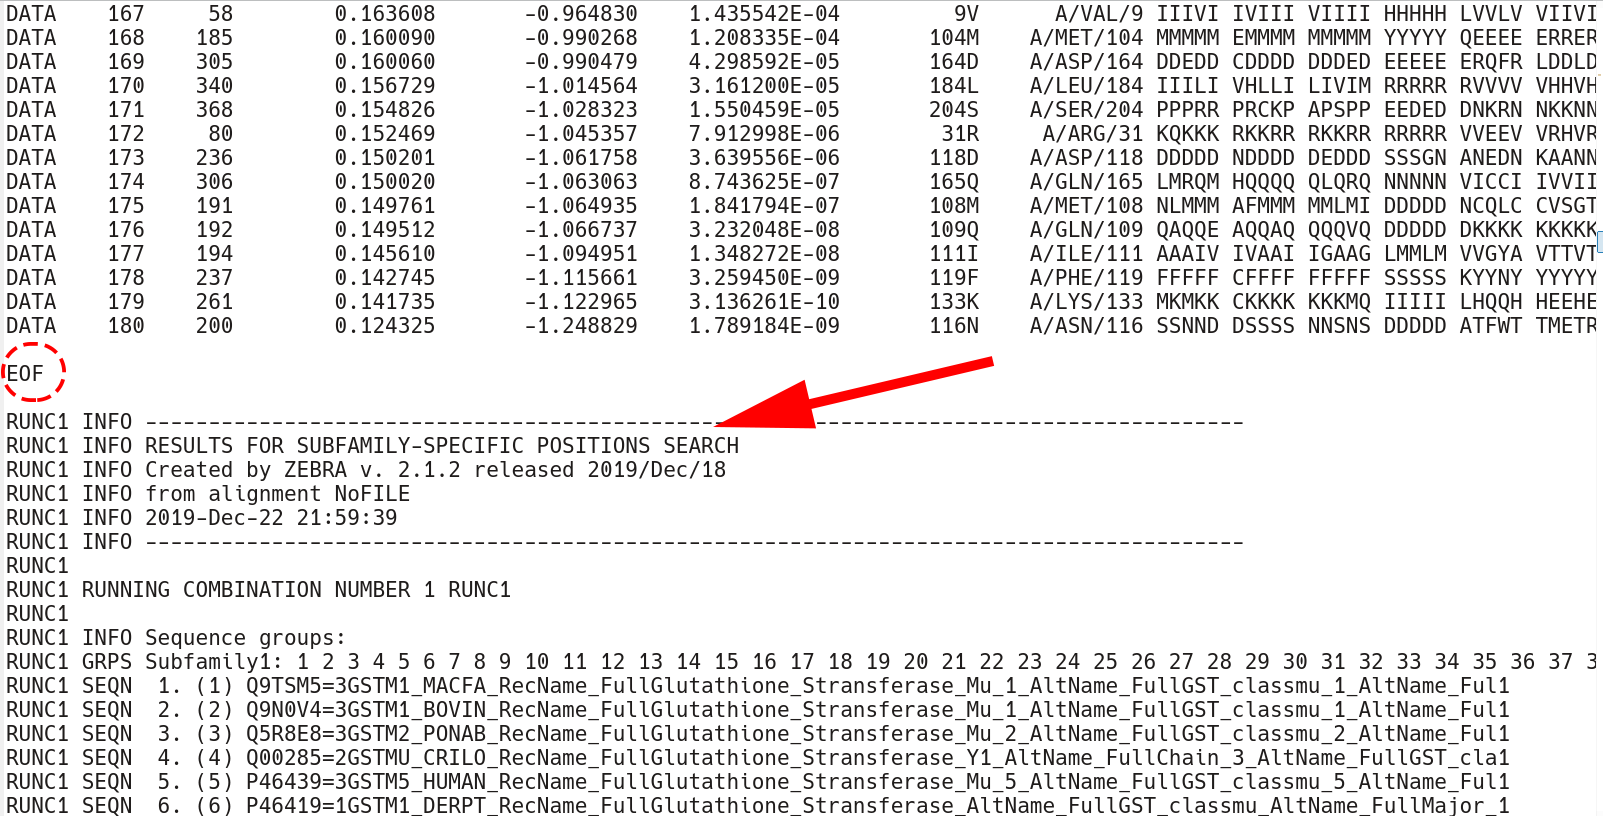
The conserved position section terminates by the EOF keyword. Then, the subfamily-specific positions section begins. This section has qualitatively the same structure as the conserved positions section, but each keyword has an additional RUNC[X] prefix, where [X] refers to the order in which subfamily classifications were analyzed.
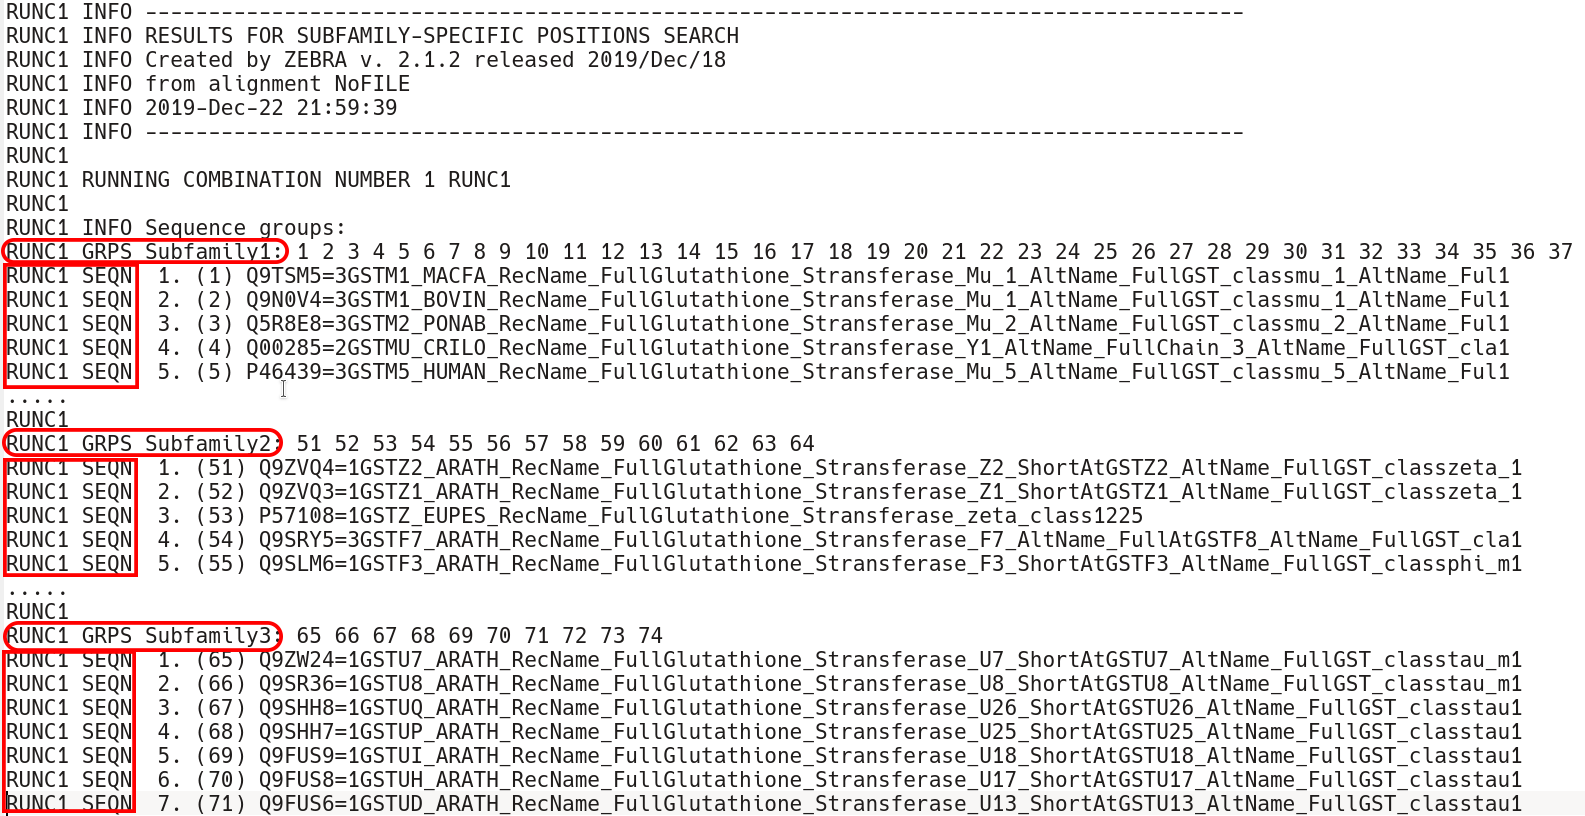
The subfamily-specific positions section begins with explicit definition of subfamilies. RUNC[X] GRPS Subfamily1 keyword states the IDs of all proteins assigned to the Subfamily1, followed by the RUNC[X] SEQN keyword with names of each protein.
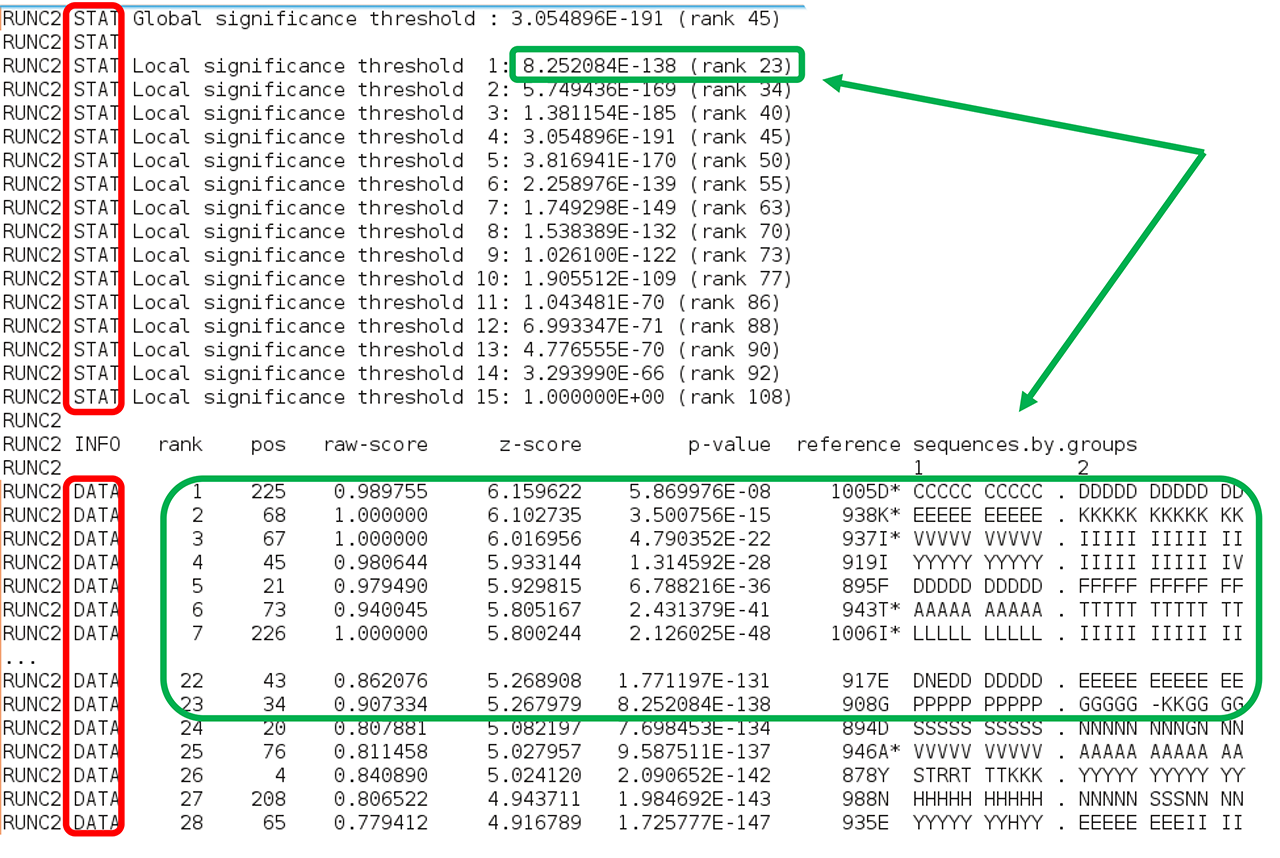
Second, comes the sequence statistics for the subfamily-specific positions. These are listed in declining statistical significance. The RUNC[X] STAT keyword provides a summary of all P-value thresholds, global and local, see below. The RUNC[X] DATA keyword provides the following information for each position (i.e., a column in the input multiple alignment): its statistical rank (rank), column ID (pos), statistical evaluation details (raw-score, z-score, p-value), the corresponding amino acid residue in the representative protein (SEQref - in the sequence, PDBref - in the 3D-structure), and the complete amino acid content of the column separated into subfamilies. The P-value for position #n estimates the significance of the first n positions, i.e., the P-value corresponds to a set of positions which includes the current position (#n) together with all positions that are statistically more significant then itself (from 1 to n-1). The lower P-value of column #n followed by a higher (i.e., poorer) P-value of column #n+1 defines a local statistical significance threshold. The lowest P-value among all columns in the multiple alignment defines the global statistical significance threshold. The lowest P-value among all columns in the multiple alignment (i.e., the global statistical significance threshold) automatically highlights a set of the most statistically significant subfamily-specific positions for the current classification.
The subfamily-specific positions section is terminated by the EOF keyword, followed by yet another two sections with conserved and subfamily-specific positions corresponding to the next subfamily classification. The output text file is concluded by the "FINAL STATISTICS" section with a summary of the statistical significance of all subfamily classifications (which was already discussed in the beginning of this part of the on-line documentation, click here). Finally, the date and time of normal termination will appear in the text file, followed by the last EOF statement.
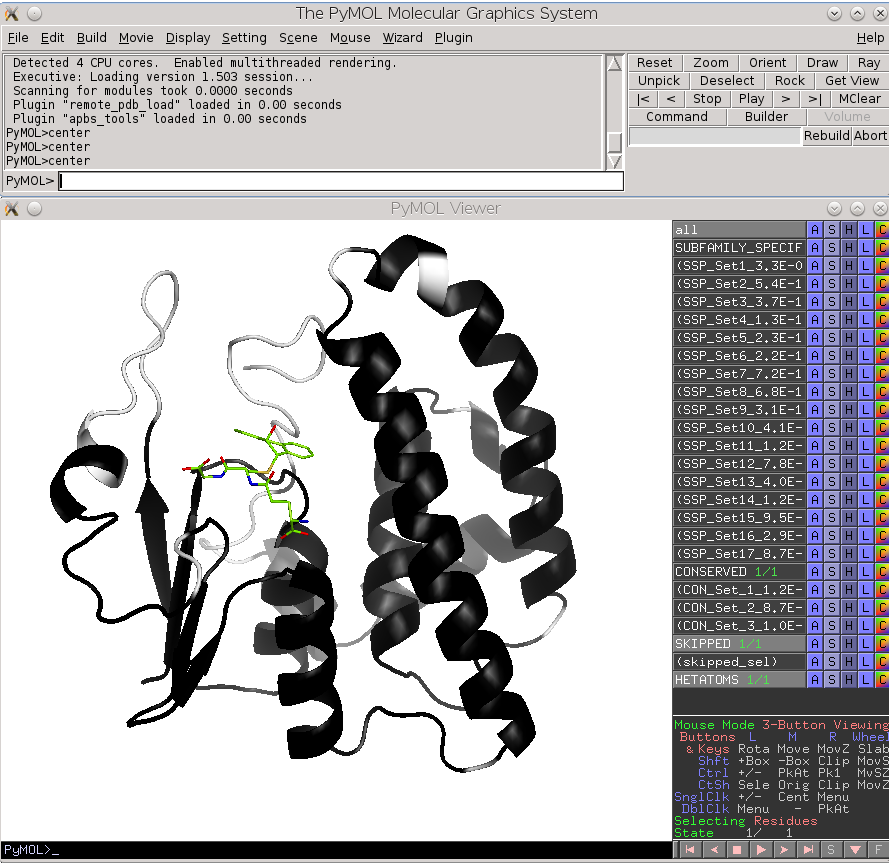
Finally, the Zebra 3D-annotation files are PyMol Molecular Graphics System 'PSE' session files that were designed to complement the Zebra text output file. These graphical annotations feature the conserved and specific positions mapped onto the representative protein 3D-structure, and are qualitatively similar to the on-line tools for sequence-based and 3D-structure-based analysis of conservation and variability (see above). For each functional classification a separate 3D-annotation 'PSE' session will be generated by the server. Each 'PSE' session file contains four layers of 3D-annotation for the selected functional classification: featuring the (1) conserved, (2) subfamily-specific, (3) skipped positions, and (4) heteroatoms, as previously discussed for the on-line tools (see above). The conserved and specific positions are grouped into PyMol objects according to the local and global P-value thresholds ranked in declining statistical significance, with backbone atoms of the corresponding layer gradient-painted according to statistical significance of the corresponding positions. For the conserved positions, the backbone of each position in the representative protein structure will be gradient-painted yellow-to-grey according to the corresponding statistical significance Z-scores with intensive yellow indicating highly conserved positions and grey - non-conserved positions. For the specific positions, the gradient paint is red-to-cyan, with intensive red indicating highly specific positions and cyan - non-specific positions. Skipped positions are painted in white and correspond to the columns in the multiple alignment that were skipped by the bioinformatic analysis due to high content of gaps or/and if explicitly dismissed by the user in the "Select columns by ..." mode (see the selection of positions for bioinformatic analysis in the Parameters section).
 |
 |
| Subfamily-specific positions | Conserved positions |
 |
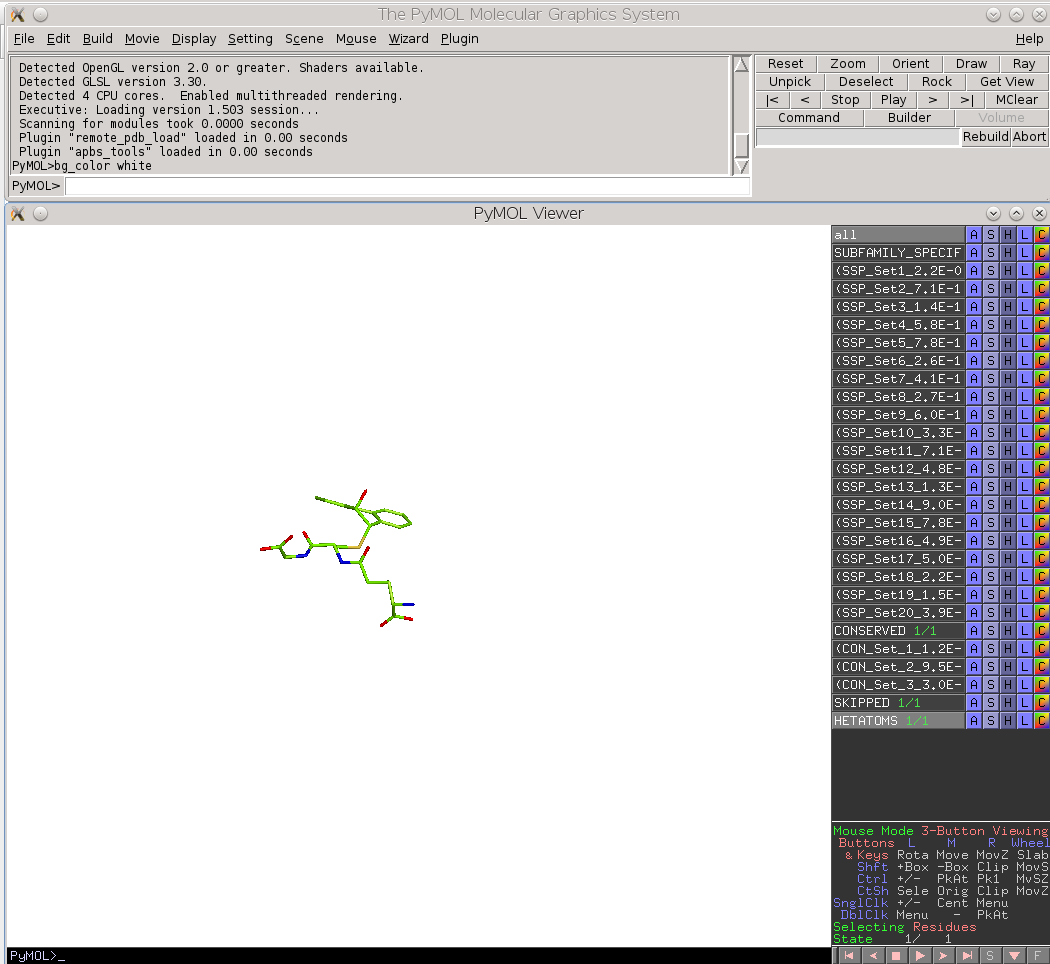 |
| Skipped positions | Heteroatoms |